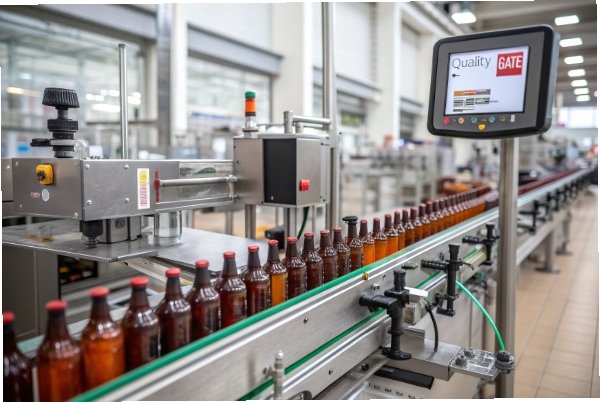
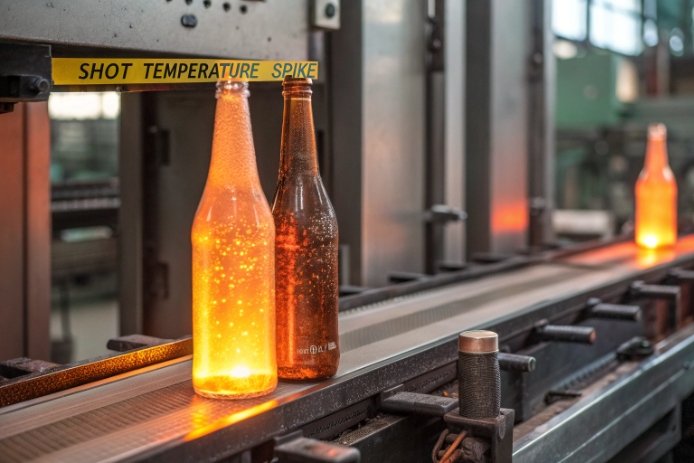
A bottle can look fine in samples, then slump in a hot warehouse or deform at the filler. That pain often starts with one overlooked viscosity point.
Softening point is a composition-driven viscosity milestone. More network formers (SiO₂, Al₂O₃) usually push softening higher, while more alkalis (Na₂O, K₂O) usually pull it lower.

Softening point is a viscosity milestone, not a “magic temperature”
Softening, annealing, and Tg are different checkpoints on the same curve
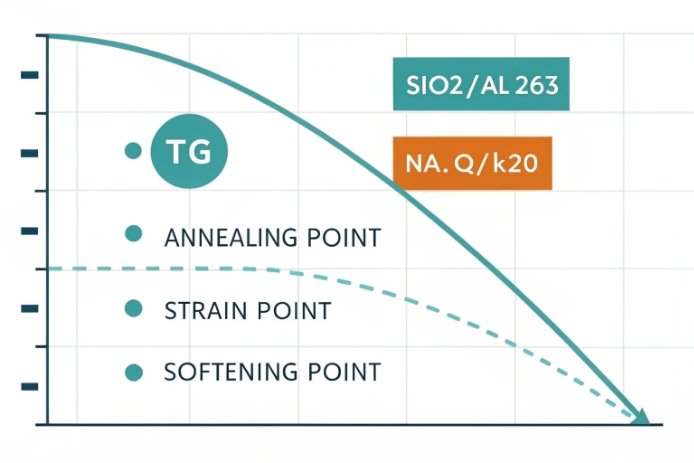
In bottle glass, temperature alone does not explain behavior. Viscosity 1 does. Softening point, annealing point, and Tg (Glass Transition Temperature) 2 sit on one viscosity–temperature curve. Softening point marks the point where glass can deform under its own load. Annealing point marks where stresses relax fast enough to matter in the lehr. Tg is a transition region, often measured by DSC 3, where the structure changes from “frozen” to “relaxing.” In daily production talk, Tg and annealing can feel close, but they are not the same thing.
Composition moves the entire viscosity curve. If the curve shifts up (higher viscosity at the same temperature), the softening point goes up. If the curve shifts down, softening goes down. This is why a small recipe change can create big forming changes even when the bottle shape looks unchanged.
The composition levers act like “network tightness” vs “network loosening”
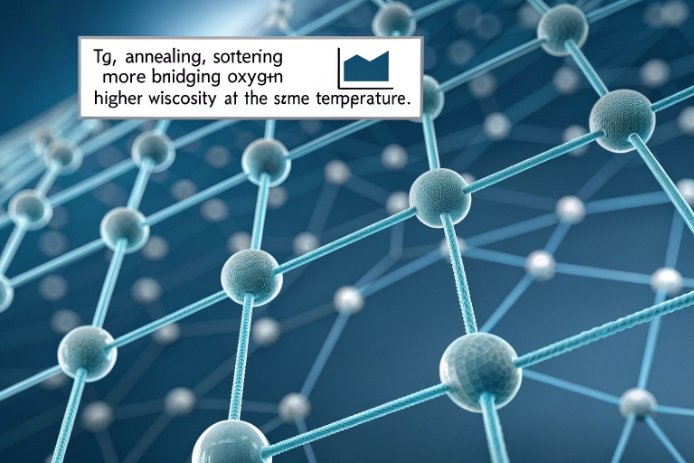
Bottle glass is mostly a silica 4 network modified by alkalis and stabilized by alkaline earths. When the network is tighter, ions move less and the melt resists flow. That raises Tg, annealing, and softening. When the network is looser, the melt flows more easily. That lowers these points.
A useful mental model is this:
-
SiO₂ and Al₂O₃ tend to increase network connectivity and raise viscosity checkpoints.
-
Na₂O and K₂O tend to increase mobility and lower viscosity checkpoints.
-
CaO and MgO can stabilize durability, but they also interact with liquidus and devitrification 5 risks if pushed too far.
-
B₂O₃ can act as a flux in many systems, often lowering high-temperature viscosity, but it must be used with clear goals.
A quick interpretation table for buyers
| Oxide change (typical direction) | Tg / annealing | Softening | Usual trade-off to watch |
|---|---|---|---|
| ↑ SiO₂ | up | up | harder melting, higher energy |
| ↑ Al₂O₃ | up | up | higher viscosity, possible devit window shift |
| ↑ Na₂O / K₂O | down | down | lower durability, higher expansion |
| ↑ CaO / MgO (replacing SiO₂) | mixed | often down at high T | liquidus/devitrification control |
| ↑ B₂O₃ (in soda-lime family) | often down or mixed | often down | volatility, composition sensitivity |
Softening point becomes easy to interpret when it is treated as “where the viscosity curve crosses the softening level.” Composition is the main reason that crossing moves.
When this logic is clear, the four questions below become much easier to answer and much easier to control in purchasing and production.
Which composition factors move Tg, annealing, and softening?
Small oxide changes can feel harmless on paper. On a hot line, they can change how a gob stretches, how a finish holds shape, and how fast stress relaxes.
Tg, annealing, and softening move together when the whole viscosity curve shifts. SiO₂ and Al₂O₃ usually push them higher, while Na₂O and K₂O usually pull them lower. CaO/MgO and B₂O₃ fine-tune the curve but can add devitrification or volatility concerns.
Network formers and intermediates: the “raise viscosity” group
SiO₂ is the backbone. When SiO₂ rises, the network becomes more connected, and viscosity increases across a wide temperature range. That usually raises Tg, annealing, and softening. Al₂O₃ often acts like a network intermediate. In many container-like silicate systems, higher Al₂O₃ tends to increase viscosity and push viscosity points upward. This can help heat resistance and scratch baseline, but it also can narrow forming comfort if the furnace and forehearth cannot hold tighter temperatures.
Modifiers: the “melt easier” group
Na₂O and K₂O break up the network and create more non-bridging oxygen 6. This usually lowers viscosity at a given temperature. Tg, annealing, and softening tend to drop. That can help melting and forming, but it can reduce chemical durability and increase thermal expansion. In other words, it can make bottles easier to make and harder to keep stable in harsh use.
Stabilizers and mixed effects: CaO, MgO, and friends
CaO and MgO are often used to stabilize durability and tune viscosity. Replacing SiO₂ with alkaline earth oxides can reduce viscosity at high temperatures in many practical glasses. That can lower softening or change the slope of the viscosity curve. Still, these oxides also move the liquidus temperature 7 and the crystallization tendency. If the liquidus creeps too close to the working range, devitrification risk rises. That risk can show up as stones, cords, or surface crystals.
What to ask for when a supplier proposes a recipe adjustment
Instead of arguing about “more alumina” or “less soda,” buyers can ask for the three checkpoints as a set:
-
Tg (how early structure starts to relax)
-
annealing point (stress-relax behavior)
-
softening point (shape stability under load)
Then link the checkpoints to forming conditions and to the bottle use case.
| Composition knob | Moves which point most (typical) | Good for | Watch-out |
|---|---|---|---|
| ↑ SiO₂ | Tg/annealing/softening all up | heat stability, durability | higher melt temp and energy |
| ↑ Al₂O₃ | Tg/annealing up strongly | durability, surface stability | viscosity rise, forming sensitivity |
| ↑ Na₂O/K₂O | softening down fast | easier melting and forming | durability loss, expansion rise |
| ↑ CaO/MgO | slope changes, high-T viscosity | durability tuning, cost control | devitrification window shifts |
| ↑ B₂O₃ | high-T viscosity down (often) | energy saving, tuning | volatility and control needs |
A stable bottle program treats these oxides as a balanced set. Tg, annealing, and softening are the scoreboard that shows if the balance is working.
Why higher softening widens processing safety margins?
When softening is low, bottles are more sensitive to heat. They deform sooner, and small temperature errors turn into big scrap numbers.
Higher softening increases the temperature gap between “safe shape” and “danger zone.” This makes bottles more tolerant to hot-fill, pasteurization drift, warehouse heat, and short line upsets that briefly raise glass or surface temperature.
The real margin is not the furnace temperature. It is the “shape-holding” margin.
A bottle does not fail only in the furnace. Many failures happen after forming:
-
bottles sit on hot conveyors,
-
bottles cluster in accumulation zones,
-
bottles travel through warm tunnels,
-
bottles are stored in hot containers or sunny warehouses.
If softening is low, the glass reaches “easy deformation” sooner. This can show up as:
-
finish distortion (cap fit problems),
-
label panel warpage (label issues),
-
base creep (standing and stacking issues),
-
subtle ovality changes (filling line jams).
Higher softening pushes these risks to higher temperatures. That gives the operation more room for normal variation. It also reduces the need for perfect cooling in every minute of the day.
Where the safety margin matters most in real production
Hot-fill and pasteurization are obvious, but the hidden margin is often “peak events”:
-
a short stop on a hot conveyor,
-
a heater drift in a tunnel,
-
a summer warehouse with poor airflow,
-
a container stuck at port in the sun.
A bottle with higher softening can survive these events with fewer deformations.
The trade is energy and forming comfort
Raising softening often means raising viscosity. That can demand:
-
higher melting temperature,
-
tighter forehearth control,
-
careful gob temperature control.
So higher softening widens downstream safety margins but can tighten upstream forming margins. The right target depends on the buyer’s pain point. A sauce brand that hot-fills and ships in hot climates may value downstream safety more than a small energy increase.
| Area of the process | What higher softening helps | What can get harder |
|---|---|---|
| Hot-fill and warm tunnels | less shape drift | none, if forming stays stable |
| Warehouse and logistics heat | less slump and ovality drift | may require slightly higher forming temp control |
| Filling line jams | fewer distorted finishes | tighter temperature windows upstream |
| Lightweighting projects | better shape holding at low mass | higher demand on process control |
Higher softening is not about “better glass” in general. It is about buying more stability room where the business really loses money.
How to raise softening point without devitrification risks?
Many teams raise SiO₂ or Al₂O₃, then devitrification appears and defects jump. The fix is to raise softening while protecting the liquidus margin.
Raise softening by shifting the viscosity curve upward with more SiO₂ and controlled Al₂O₃, then compensate carefully with alkalis and alkaline earth balance. Devitrification risk stays low when the liquidus stays well below the working range and when the CaO/MgO/Al₂O₃ balance is kept in a safe window.
Step 1: Decide the real target: softening temperature or isokom temperature
Softening point is one viscosity level. A recipe can be tuned to hit that point, but still behave poorly at other viscosities. So the best approach is to tune the viscosity curve, not only one point. A supplier can provide “isokom temperatures” 8 at several viscosities (forming, working, softening, annealing). This shows whether the whole curve stayed healthy.
Step 2: Increase network formers in a controlled way
Raising SiO₂ is a direct path to higher softening. Raising Al₂O₃ can also help, but Al₂O₃ can raise viscosity strongly and can shift crystallization behavior. The safest pattern is small steps, with measured results, not a large jump.
Step 3: Protect the liquidus margin
Devitrification risk rises when crystals can form near the working end. In container glass, phases like wollastonite 9, cristobalite, or devitrite can become problems depending on composition and thermal history. The practical rule is simple: keep a healthy temperature gap between:
-
the liquidus temperature (where crystals are stable), and
-
the working/forehearth temperature range.
If the gap gets too small, stones and cords become more likely, and the forehearth becomes sensitive to small cooling events.
Step 4: Use alkalis and alkaline earths as “shape tools,” not brute-force tools
If SiO₂ and Al₂O₃ rise, the melt may need help to stay workable. A small alkali adjustment can recover meltability. A careful CaO/MgO balance can keep durability stable. The goal is to raise softening without pushing the melt into a crystallization-prone corner.
| Recipe move | Helps softening | Helps devit risk | Typical safe control action |
|---|---|---|---|
| ↑ SiO₂ | strong | mixed | validate viscosity curve + melting energy |
| ↑ Al₂O₃ | strong | can help or hurt | check liquidus and crystal phases in trials |
| ↓ Na₂O/K₂O | medium to strong | often helps durability | watch forming temperature sensitivity |
| tune CaO/MgO | indirect | strong | keep liquidus margin and avoid crystal windows |
| ↑ cullet (clean, controlled) | indirect | mixed | keep chemistry stable to avoid drift |
The best result comes from treating devitrification as a design constraint from day one. Softening is the goal. Liquidus margin is the guardrail.
Can data models forecast softening from oxide ratios?
Many buyers want a quick formula: “If Na₂O drops 0.5%, softening rises X.” Real glass is not that linear, but models are good enough to guide decisions when they are used the right way.
Yes. Statistical and physics-based viscosity models can forecast softening by predicting the viscosity–temperature curve from composition. Once the curve is predicted, softening is just the temperature where viscosity hits the softening level. Modern ML models trained on large glass databases can also estimate Tg and viscosity points from oxide inputs.
What the models really predict
Most practical models do not predict “softening point” directly. They predict viscosity as a function of offering:
-
composition (oxide wt% or mol%),
-
temperature.
Then softening is derived by selecting the viscosity level used to define softening. This is powerful because the same model can also give working point and annealing point. That is what operations teams need.
Why oxide ratios still matter
Even with models, ratios are useful for fast thinking:
-
(SiO₂ + Al₂O₃) acts like a “network strength” indicator.
-
(Na₂O + K₂O) acts like a “mobility” indicator.
-
CaO/MgO and CaO/Al₂O₃ ratios often signal where viscosity and crystallization behavior may change quickly.
Ratios are not a replacement for a model. They are a simple early warning tool.
How to use models in a purchasing workflow
A buyer can ask a supplier for two outputs:
1) the predicted viscosity curve for the proposed composition range, and
2) the predicted isokom temperatures (forming, softening, annealing).
Then the buyer can compare suppliers on performance, not only on a single oxide list.
What makes model results trustworthy
Model accuracy depends on:
-
having the composition in the same family as the model training data,
-
controlling minor oxides that still influence viscosity (Fe₂O₃, SO₃, B₂O₃, etc.),
-
using actual measured data to calibrate the model for that furnace.
A model is strongest when it is tied to plant history. That is where it stops being “data science” and becomes “process control.”
| Model output you should request | Why it helps | What to do with it |
|---|---|---|
| Viscosity curve (η vs T) | shows full processing window | compare before and after recipe tweaks |
| Isokom temperatures | converts curve to clear checkpoints | write into internal control plans |
| Sensitivity report | shows which oxide causes the largest shift | decide which raw materials need tighter control |
| Validation points | proves the model matches reality | require periodic lab viscosity or fixpoint checks |
Data models can forecast softening from oxide ratios and full compositions, but the real value is faster decision making with fewer furnace surprises.
Conclusion
Composition shifts the viscosity curve, and softening is one point on that curve. Raise softening with more network strength, keep liquidus margin safe, and use models to predict changes before production.
Footnotes
-
Viscosity: A measure of a fluid’s resistance to flow, which determines how glass behaves during melting, forming, and annealing. ↩
-
Tg (Glass Transition Temperature): The temperature range where a hard, brittle glass transitions into a viscous, rubbery state. ↩
-
DSC: A thermoanalytical technique used to measure the difference in the amount of heat required to increase the temperature of a sample and reference. ↩
-
Silica: Silicon dioxide (SiO₂), the primary network-forming oxide in glass, providing structural integrity and high viscosity. ↩
-
Devitrification: The crystallization of glass, which can degrade mechanical strength and optical clarity if not controlled. ↩
-
Non-bridging oxygen: Oxygen atoms in the glass network that are bonded to only one network former, reducing network connectivity and viscosity. ↩
-
Liquidus temperature: The temperature above which a material is completely liquid; cooling below this point can trigger crystallization. ↩
-
Isokom temperatures: Temperatures at which glass exhibits specific viscosity values, used to characterize forming and working ranges. ↩
-
Wollastonite: A calcium silicate mineral that can form as a devitrification product in soda-lime glass if composition and cooling are not managed. ↩