Forming problems often start as “small” viscosity drift. Then gobs change, defects rise, and the line slows while everyone argues about furnace settings.
Glass composition changes viscosity by changing how connected the silicate network is. More network formers raise viscosity, and more modifiers lower it, but the full curve depends on temperature and oxide balance.

Viscosity is the fingerprint of the glass network
How the network structure sets melt flow
Melt viscosity is basically how hard it is for atoms to rearrange while the glass flows. When the network is highly connected, the melt resists movement and viscosity is high. When the network is “opened” by modifiers, the melt moves easier and viscosity drops.
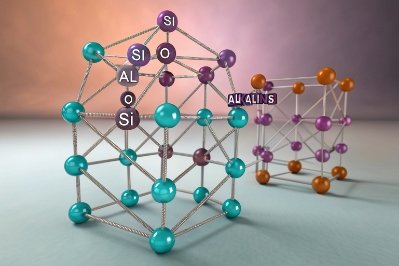
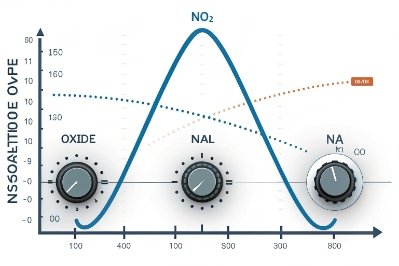
In bottle glass, the network is mainly built from SiO₂ units linked by oxygen. When modifiers like Na₂O and K₂O are added, they create non-bridging oxygens. That reduces connectivity. The melt becomes less “polymerized,” so it flows easier at the same temperature. This is why alkalis are strong fluxes 1.
Some oxides behave like “middle players.” Al₂O₃ can enter the network and increase connectivity, but it needs charge balance from Na⁺ or Ca²⁺. When Al₂O₃ is raised, viscosity often rises across the forming range, and the melt becomes less sensitive to short-term drift. CaO and MgO do not build the network like SiO₂, but they stabilize it. They can raise viscosity compared with pure alkali silicates, and they often change how steep the viscosity curve 2 is with temperature.
Why the viscosity curve shape matters, not only one value
A plant does not live at one viscosity. The furnace needs one range for melting and fining, the forehearth needs another, and the IS machine needs a tight forming range. Composition changes can shift:
-
the absolute viscosity at key temperatures
-
the slope of viscosity vs temperature (how “touchy” the glass feels)
-
the gap between melting viscosity and working viscosity (how wide the process window is)
A practical way to see it is to track three “anchors”: melting, conditioning, and forming.
| Zone | What viscosity controls there | What composition shifts do | Typical risk if uncontrolled |
|---|---|---|---|
| Furnace melt/fining | Dissolution, bubble removal, mixing | Alkali lowers viscosity, SiO₂/Al₂O₃ raises | Seeds, cords, slow melting |
| Forehearth conditioning | Temperature stability, shear, homogeneity | Al₂O₃/CaO/MgO can stiffen and stabilize | Temperature chase, weight drift |
| Forming (gob) | Shape, shear marks, wall thickness | Higher modifiers flow easier, higher formers resist | Thin walls, checks, rejects |
A clean “mechanism summary” for procurement and QA
When someone asks why viscosity changed, the most honest answer is: the network connectivity changed, or the temperature profile changed, or both. That is why chemistry control and thermal control must be treated as one system, not as two separate jobs.
The next sections break this into the four questions that usually come up in audits and improvement projects.
If the mechanism is clear, the fixes become faster and less emotional.
What network effects govern melt viscosity curves?
When a line feels unstable, the real cause is often inside the network. Small oxide shifts can change how the melt responds to the same temperature.
Melt viscosity curves are governed by network polymerization, non-bridging oxygen content, and how “strong” the bonds are. SiO₂ and Al₂O₃ usually raise viscosity, while Na₂O/K₂O lower it, and CaO/MgO reshape the curve through stabilization.
Polymerization and non-bridging oxygen drive flow resistance
Think of the network like a 3D web. A more connected web is harder to deform. Adding Na₂O breaks some bridges and creates non-bridging oxygen 3 sites. That reduces the number of constraints holding the network in place. The melt flows with less resistance, so viscosity drops.
“Intermediate” oxides change the curve more than people expect
Al₂O₃ is the classic example. When it is properly charge-balanced, it adds connectivity and raises viscosity. It also often makes the glass less sensitive to minor thermal swings because the network is more constrained. This can feel like “more stable glass,” but it can also narrow forming flexibility if the forehearth is already close to limits.
CaO and MgO also matter because they affect how modifiers behave. A high-alkali, low-stabilizer melt can be very fluid, but it can also be chemically weaker and more sensitive to drift. Adding stabilizers can increase viscosity and also smooth out some of the volatility in the melt’s behavior.
Temperature dependence is part of the mechanism
Viscosity is not linear with temperature. In glass, it often follows a curved relationship where a small temperature shift near forming can cause a big viscosity change. Composition changes can make this temperature sensitivity steeper or flatter. That is why two glasses with the same viscosity at one point can behave differently across the whole forehearth range.
| Oxide group | Network role | Typical viscosity effect | What it does to the curve feel |
|---|---|---|---|
| SiO₂ | Primary network former | Raises viscosity | Makes melt “stiffer,” can widen durability margin |
| Al₂O₃ | Network former (when balanced) | Raises viscosity | Often reduces drift sensitivity, but needs melting discipline |
| Na₂O/K₂O | Modifier/flux | Lowers viscosity | Makes melt “faster,” can raise sensitivity and durability risk |
| CaO/MgO | Stabilizer/modifier | Often raises vs alkali-only melts | Can stabilize behavior, but must avoid devit-prone windows |
| B₂O₃ (if used) | Former/intermediate | Can lower viscosity at melt temps | Can help meltability, but needs tight control if used |
What to watch when the curve shifts
If the curve shifts up (higher viscosity), the line often needs higher forehearth temperature to hold weight. If the curve shifts down, gobs can become “soft,” and defects tied to over-fluid flow can rise. The network explanation keeps this simple: connectivity went up or down.
Why viscosity targets affect forming speed and defects?
Viscosity is not only a lab number. It is the timing system of the whole forming line. When it drifts, the machine does not forgive it.
Viscosity targets set how fast gobs can be delivered, shaped, and cooled without defects. If viscosity is too low, glass runs and thins. If too high, glass does not fill molds well and stress rises, which drives checks, stones sensitivity, and breakage.
Why forming speed depends on a narrow viscosity band
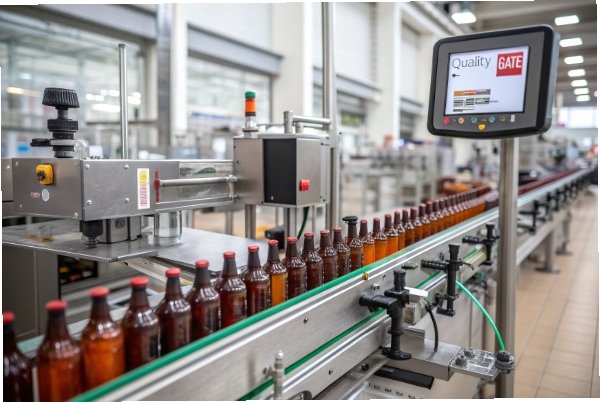
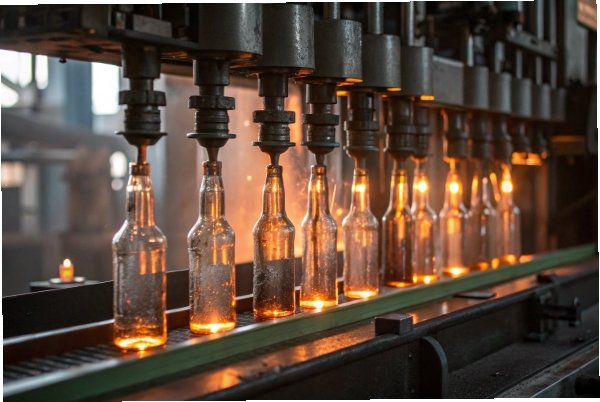
A bottle line runs on repeatable cycles. The gob 4 must have the right “body” when it drops, then the right flow during parison formation, then the right stiffness during final blow. This is why plants track target viscosity near the working range. If the melt is too fluid, it slumps and becomes thin in the wrong places. If it is too stiff, it does not distribute properly and can trap defects.
Common defect patterns tied to viscosity drift
When viscosity is low at forming:
-
thin walls and weak spots rise
-
sagging and poor finish definition appears
-
shear marks and surface waviness can increase
When viscosity is high at forming:
-
poor mold filling leads to shape defects
-
higher forming pressure can increase checks
-
temperature chasing increases, and weight variation rises
The key point is that viscosity drift forces operators to chase temperatures. That chasing itself creates more variation, so defects rise even if the average seems “close.”
Why viscosity targets also protect furnace and forehearth stability
If viscosity targets are missed, the forehearth must compensate with temperature. That can change:
-
volatilization behavior
-
redox balance in small ways
-
mixing effectiveness
-
thermal gradients that add cords
So viscosity is also a quality stability tool. Hitting the viscosity target reduces the need for “emergency” temperature moves.
| Viscosity condition at forming | What operators see | What defects increase | Typical root cause |
|---|---|---|---|
| Too low | Glass looks “runny” | Thin walls, slumps, waviness | High alkali, low stabilizer, too hot |
| Too high | Glass looks “stiff” | Poor fill, checks, heavy seams | Higher SiO₂/Al₂O₃, too cold, curve shifted |
| Stable and on-target | Steady gob and weight | Lower reject rate | Stable chemistry + stable thermal profile |
Why buyers feel viscosity problems even if they never hear the word
Viscosity drift becomes:
-
heavier bottles to “save strength”
-
more dimensional scatter
-
more random breakage
-
more delivery risk due to high scrap
This is why viscosity targets belong in the same document as chemistry windows for serious programs.
How to model viscosity from oxide percentages?
Modeling viscosity helps because it reduces trial-and-error. It also helps plants predict what will happen when cullet chemistry shifts or when raw sources change.
Viscosity can be modeled from oxide percentages by fitting composition to parameters in a viscosity equation across temperature, then validating with plant data. Practical models use SiO₂/Al₂O₃ as structure drivers and Na₂O/K₂O as flux drivers, with CaO/MgO shaping the curve.
Two levels of modeling that work in factories
A simple approach uses an internal regression model:
-
Input: oxide % (SiO₂, Na₂O, CaO, MgO, Al₂O₃, and key minors)
-
Output: predicted log(viscosity) at one or two key temperatures
This works well when the plant mainly cares about a forming target.
A more complete approach models the full curve using a temperature-dependent equation. Many teams fit viscosity behavior with a curve form and predict the curve parameters from composition. This is useful when the furnace, forehearth, and forming windows all need to be managed together.
How to build a model without turning it into a science project
A practical workflow is:
-
Pick two or three key viscosity points that matter for the line.
-
Collect chemistry data by shift (XRF on finished glass).
-
Collect process data that reflects viscosity demand (forehearth setpoint needed to hold gob weight).
-
Fit a model that links chemistry to those targets.
-
Validate on new lots and keep updating it.
This method ties the model to production reality. It also naturally includes cullet chemistry effects, because cullet shifts show up in the XRF 5.
What variables matter most in a bottle plant model
SiO₂ and Al₂O₃ often push viscosity up. Na₂O and K₂O push it down. CaO and MgO modify the response and can change the slope of the curve with temperature. Minor oxides can matter when colorants, sulfate systems, or redox shifts are large enough to change melt behavior.
| Model input group | Why it matters | How it shows up in predictions | Common modeling mistake |
|---|---|---|---|
| Network formers (SiO₂, Al₂O₃) | Controls connectivity | Raises viscosity and stiffens curve | Ignoring charge-balance effects |
| Modifiers (Na₂O, K₂O) | Controls flow and meltability | Lowers viscosity, increases sensitivity | Treating Na₂O as constant when cullet drifts |
| Stabilizers (CaO, MgO) | Controls stability and slope | Shapes curve, improves repeatability | Pushing stabilizers without devit checks |
| Minors/impurities | Can shift melt behavior | Small but real drift | Assuming they are always negligible |
How to present model outputs so production trusts them
Production trusts models that:
-
predict the direction correctly
-
reduce temperature chasing
-
come with clear limits and alerts
A model should not pretend to be perfect. It should be an early warning tool that helps operators stay inside a known window.
Are inline rheology proxies improving furnace control?
A true molten-glass rheometer 6 inline is rare in most bottle plants. Still, plants are getting better at “measuring viscosity” through proxies tied to flow, temperature, and gob behavior.
Yes. Inline rheology proxies like forehearth temperature demand, gob weight stability, plunger/orifice behavior, and camera-based gob shape tracking can detect viscosity drift early, so furnace and forehearth control becomes faster and calmer.
What counts as a rheology proxy in a bottle factory
A proxy is any signal that shifts when viscosity shifts, even if it is not a direct viscosity measurement. The most useful proxies are already available in many plants:
-
Forehearth temperature needed to hold constant gob weight
-
Gob temperature measurements and their stability over time
-
Gob shape or neck-down behavior seen by cameras
-
Feeder plunger load, timing sensitivity, and shear behavior at the orifice
-
Reject patterns that correlate strongly with “too stiff” or “too soft” behavior
These signals respond fast. That is the real value. Lab viscosity tests are accurate, but they are slow for daily control.
Why proxies help furnace control, not only feeder control
Viscosity drift is often driven by furnace-side changes:
-
batch blanket changes from cullet moisture or fines
-
energy distribution shifts
-
chemistry drift from cullet or raw variation
When proxies are tracked and linked to chemistry, the plant can respond earlier. This reduces the need for big temperature swings that create more defects.
The best proxy systems are “closed-loop”
The best approach is to combine:
-
chemistry tracking (XRF by shift)
-
thermal tracking (furnace and forehearth profiles)
-
forming outputs (weight, defect rate, gob camera metrics)
Then control can be predictive, not reactive. Even simple rules help, like: “If forehearth setpoint rises by X for the same weight, check chemistry drift and cullet mix.”
| Proxy signal | What it suggests | What action is practical | What to confirm |
|---|---|---|---|
| Forehearth setpoint creeping up | Viscosity rising or heat loss | Check cullet chemistry, adjust heat balance | XRF and temperature profile |
| Gob shape becomes longer/softer | Viscosity dropping or overheating | Reduce local temperature, check modifier drift | Weight stability and defects |
| Plunger sensitivity increases | Narrower working window | Stabilize conditioning zone | Temperature uniformity |
| Defects shift to thin walls | Too fluid at forming | Adjust temperature and verify chemistry | Na₂O/K₂O and stabilizers |
| Defects shift to poor fill/checks | Too stiff at forming | Raise temperature or adjust chemistry window | Al₂O₃/SiO₂ drift and cooling issues |
What to avoid when adopting proxies
A proxy system fails when it is treated as “one sensor equals one truth.” The best systems use a small set of signals and look for patterns. This reduces false alarms and builds trust with operators.
Conclusion
Composition changes viscosity by changing network connectivity and temperature sensitivity. Stable oxide windows, practical models, and inline proxies 8 keep forming fast and defects low.
Footnotes
-
[Flux materials added to glass batches to lower melting points and modify viscosity.] ↩
-
[Graphical representation of how glass melt viscosity changes with temperature.] ↩
-
[Oxygen atoms in the silicate network linked to only one silicon atom, reducing structural rigidity.] ↩
-
[A precise lump of molten glass cut from the feeder to form a single bottle.] ↩
-
[X-ray Fluorescence spectrometry used for rapid chemical analysis of glass composition.] ↩
-
[Instruments used to measure the flow and deformation of matter under applied stress.] ↩
-
[The rate at which molten glass is drawn from the furnace, affecting melting dynamics.] ↩
-
[Virtual sensors using process data to estimate hard-to-measure variables like viscosity.] ↩