TiO₂ looks like a tiny number on a batch sheet. Then haze appears, transmittance drops, and the “water-white” look is gone.
TiO₂ only stays “invisible” when it stays dissolved and evenly distributed. Haze starts when Ti forms micro-crystals (often rutile) or concentrates in pockets, which scatter visible light and reduce T_550.

Why does TiO₂ sometimes turn clear glass hazy?
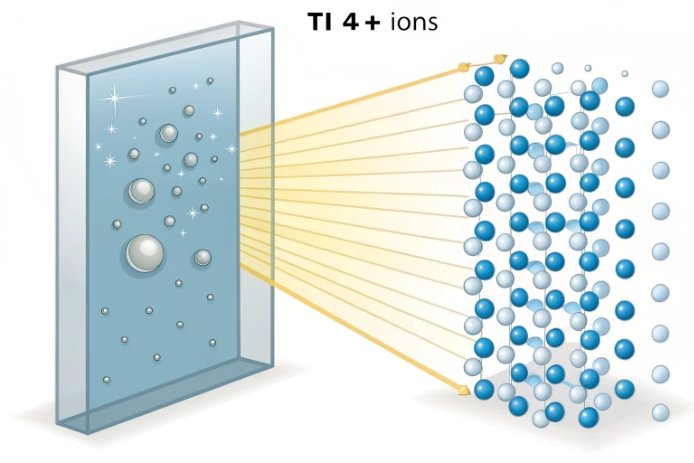
Transparency loss from TiO₂ is usually not a simple absorption problem. It is a scattering problem. Dissolved titanium (Ti⁴⁺ in the glass network) can be nearly invisible in the visible range at low levels. The trouble starts when TiO₂ is no longer fully dissolved or when it forms tiny crystals during cooling or in cold zones. Those crystals have a refractive index 1 that is very different from the surrounding glass. That mismatch creates strong scattering, and the human eye reads it as haze or milkiness.
The biggest practical point is this: a bottle can have a “safe” average TiO₂ number and still look hazy if Ti is not uniform. Local enrichment happens when sand has heavy-mineral streaks, when batch mixing is weak, when cullet brings Ti-rich fragments, or when a forehearth corner runs cold and gives nuclei time to grow. In those cases, rutile-sized particles in the 0.1–1.0 μm range can drive Mie scattering 2, which is explained by optics as the “most visible haze” zone.
TiO₂ also interacts with how the melt fines and homogenizes. If the furnace redox swings or foaming changes, cords 3 and striae appear more easily. Those cords can carry Ti-rich bands, and the bands scatter light even if no obvious crystals are present.
Dissolved vs crystallized titanium and what it does to optics
| Ti state in glass | What it looks like | What it does to T_550 | Typical root cause |
|---|---|---|---|
| Fully dissolved Ti⁴⁺ | clear, slight UV shift | small change | normal sand impurity, good melting |
| Ti-rich cords (no crystals) | faint streaks, “wavy” clarity | moderate loss | poor mixing, unstable fining/flow |
| Microcrystals (rutile/anatase) | haze, milkiness, sparkle specks | strong loss | cold spots, oversaturation, slow cooling |
| Ti³⁺ presence | grey/blue cast + possible haze | color shift + loss | overly reducing furnace pockets |
A good TiO₂ plan starts by separating “composition number” from “microstructure result.” Then the controls become clear.
So, the next step is to answer the dosage question in a production way, not in a lab way.
The rest of this article breaks TiO₂ transparency into four decisions: dosage, particle/crystal behavior, decolorizer/redox interaction, and QA controls.
At what TiO₂ dosage does light scattering or haze start to lower visible transmittance?
The first haze complaints usually arrive when TiO₂ crosses from “background impurity” to “nucleation risk,” or when Ti becomes uneven even at lower levels.
A practical way to think in container glass is by bands:
- Very low TiO₂ (typical clean flint sand levels): Ti is mostly dissolved and does not create haze by itself.
- Moderate TiO₂ (elevated impurity or mild intentional addition): clarity stays okay only if melting and homogeneity are excellent.
- High TiO₂ or local spikes: rutile/anatase microcrystals become likely in colder zones, and haze rises fast.
In many soda-lime flint lines, haze risk starts to become noticeable when TiO₂ approaches ~0.10–0.20 wt% in the finished glass, especially in thick-walled bottles or in lines with known cold corners. For “water-white” fragrance or premium beverage flint, many buyers push TiO₂ much lower, because even without haze, Ti can push a slight warm/grey tone and can magnify any iron tint.
Still, the most important caution is local concentration. A bottle can average 0.06% TiO₂ and still haze if a small fraction of Ti-rich grains survives melting and becomes microcrystals. That is why particle size and dissolution quality matter as much as the target number.
Practical TiO₂ dosage guidance for clarity (flint and light-tint bottles)
| Finished-glass TiO₂ (wt%) | Visibility risk | What usually happens to haze | What to watch on the line |
|---|---|---|---|
| <0.05 | low | haze stays low if melt is clean | cords from process swings, not Ti |
| 0.05–0.10 | low to moderate | haze increases only if cold spots exist | forehearth mapping and mixing |
| 0.10–0.20 | moderate | haze can appear in thick sections | stones, sparkle, faint milkiness |
| 0.20–0.40 | high | haze becomes common if cooling is slow | rutile crystals, devit skins |
| >0.40 | very high | strong scattering likely | yield loss unless process is exceptional |
What “lower visible transmittance” means in real targets
Most “water-white” programs do not accept haze first. They see T_550 drop and L* fall. A small haze increase (like 0.3% → 0.8%) can make a bottle look dull even if transmittance is still “high” on paper.
The most reliable approach is to define an internal TiO₂ control ceiling based on:
- the thickest optical path length (base and shoulder)
- the production line’s coldest forehearth zone
- the target haze and T_550 numbers
This is also why TiO₂ is usually managed by sand selection and cullet control 4 first, not by “adding decolorizers.”
How do Ti species’ particle size, solubility, and crystal phase (rutile/anatase) influence clarity?
TiO₂ affects clarity through microstructure. The same chemistry number can look clear or hazy depending on whether Ti is dissolved or present as particles.
Particle size: the most visible haze zone
Scattering depends on particle size relative to visible wavelengths (about 0.4–0.7 μm). Particles in the ~0.1–1.0 μm range often create the strongest visible haze. Larger particles can show as “sparkle” or stones. Very small particles (<~50 nm) scatter less in visible light, but they can still cause a faint opalescence if they agglomerate.
So, “fine Ti” is not automatically safe. Fine particles dissolve easier, but if they survive as clusters, they become the perfect haze scatterers.
Solubility: dissolved Ti is usually not the enemy
Dissolved Ti⁴⁺ sits in the silicate network and usually has limited visible impact at low levels. Trouble starts when:
- TiO₂ exceeds solubility at local composition and temperature
- melt residence time is too short for dissolution
- temperature gradients create “freeze-out” near walls and spouts
- batch segregation creates Ti-rich pockets
Rutile vs anatase: phase and refractive index matter
Rutile 5 is the high-temperature stable TiO₂ phase and has a very high refractive index. That makes rutile crystals strong scatterers. Anatase 6 can form under different conditions and can transform toward rutile with heat history. In bottle production, rutile is often the phase that survives and causes scattering because the melt and forming temperatures favor rutile stability.
How to connect microstructure to defects you can see
| Ti form | Likely phase | Typical size range | Visual symptom | Best prevention lever |
|---|---|---|---|---|
| Fully dissolved | none | n/a | clear | enough melt time and mixing |
| Microcrystals in cold zones | rutile (often) | 0.1–1.0 μm | haze, dullness | eliminate cold spots, raise margin |
| Larger inclusions | rutile/complex Ti phases | >1–10 μm | sparkle stones | raw material screening, dissolution |
| Agglomerates | mixed | 0.05–0.5 μm clusters | light haze | better batch mixing and fining stability |
The clearest message is: TiO₂ transparency is controlled more by where Ti sits than by how much Ti exists.
Does TiO₂ interact with Fe/Se/Co decolorizers and furnace redox to shift color or increase turbidity?
Yes, and the interaction often shows up as “tone drift plus haze,” which is the worst combination for premium flint bottles.
Redox: Ti is not only Ti⁴⁺ in unstable furnaces
Titanium can change oxidation state. Under more reducing conditions, some Ti³⁺ can form. Ti³⁺ can contribute to a grey/blue cast. In practice, Ti redox shifts usually appear when the furnace has reducing pockets from:
- organics in cullet
- unstable combustion and oxygen potential
- overuse of reducers for fining or amber control
At the same time, Fe²⁺/Fe³⁺ balance shifts with redox. That changes green/yellow tone. So a redox swing can change both Ti and Fe behavior in one move. That makes the glass look “dirty” even if haze is only moderate.
Decolorizers: Se and Co are redox-sensitive
Se and Co work as tone adjusters. They are powerful at tiny doses. Their effect depends on redox state and on what iron is doing. When TiO₂ is present at higher levels, operators sometimes push oxidation harder to keep Ti as Ti⁴⁺ and to stabilize fining. That oxidation push can also change:
- Fe²⁺ fraction (often lowering green tone)
- Se expression (risk of warm/pink drift if overdosed)
- Co expression (risk of cold/blue cast)
If TiO₂ is causing microcrystals, no decolorizer will fix haze. It will only hide color while turbidity stays.
TiO₂ and turbidity: the process chain that creates haze
The most common chain is:
1) TiO₂ rises or becomes uneven
2) furnace redox 7 and fining become less stable (foam and cords increase)
3) cold zone crystallization begins near walls/spouts
4) haze and cords increase together
A practical interaction map for flint bottle teams
| Variable | What it shifts | Transparency risk | What to hold steady |
|---|---|---|---|
| Furnace oxygen potential | Fe²⁺/Fe³⁺, Ti³⁺/Ti⁴⁺ | cords + tone drift + haze | stable combustion and cullet organics control |
| Se dose | yellow/green correction | pink/grey drift if redox changes | micro-dose control, stable redox |
| Co dose | neutralizing yellow | blue cast, “cold” look | narrow feed tolerance |
| Total iron | base tint strength | visible tint in thick base | low-Fe sand and cullet discipline |
| TiO₂ level and uniformity | nucleation + scattering | haze and milkiness | raw material screening and mixing |
In a premium “water-white” program, the best rule is: fix scattering first, then tune color. If scattering is ignored, color tuning becomes a daily chase.
Which process controls and QA metrics (CIE Lab*, haze %, T_550) keep a water-white look when using TiO₂?
When TiO₂ is present, the system must be controlled like a premium flint line: tight inputs, stable furnace, and hard QA gates.
Process controls that prevent haze
1) Raw material control
- Specify sand TiO₂ and heavy-mineral content, not only Fe₂O₃.
- Control sand grain size distribution to avoid Ti-rich coarse grains.
- Keep cullet streams clean and color-pure. Avoid mixed specialty cullet.
2) Melting and homogeneity
- Ensure enough residence time and temperature margin to dissolve Ti-bearing grains.
- Reduce stagnant zones and improve mixing to prevent Ti-rich cords.
- Stabilize fining chemistry so bubble removal does not create foam bands.
3) Temperature uniformity
- Map forehearth and feeder wall temperatures and fix cold corners.
- Avoid long holds in the “danger band” where crystals can grow on walls.
4) Redox stability
- Control cullet organics and batch reducers to prevent local reducing pockets.
- Keep oxygen potential stable so iron and titanium do not swing together.
QA metrics that catch TiO₂ transparency loss early
Water-white control needs both color and scattering metrics:
-
*[CIE Lab](https://en.wikipedia.org/wiki/CIELAB_color_space)** 8 (D65/10° is common):
- L tracks brightness (lower L often means haze or tint).
- a and b track tone drift.
-
Haze %:
- Haze is the most direct scattering indicator.
- A tight haze spec prevents “dull but color-correct” failures.
-
T_550 (visible transmittance at 550 nm):
- Use a standard thickness coupon (like 2–3 mm) for stable comparison.
- Track trend and set an alarm before customers see it.
Simple internal targets that work for many “water-white” programs
Exact numbers depend on thickness and instrument, but many teams use targets like:
- Haze ≤ 0.5% on a standard plaque (tight programs may go ≤ 0.3%)
- T_550 ≥ 90% on a standard plaque thickness
- *L ≥ 96** (and stable)
- *a near 0** (for example, between -0.3 and +0.3)
- *b near 0** (for example, between -0.5 and +0.5)
- ΔE control lot-to-lot (for example, ΔE ≤ 0.8)
QA and control plan for TiO₂-containing flint lines
| Control layer | Metric | Frequency | Early warning sign |
|---|---|---|---|
| Incoming sand | TiO₂, heavy minerals, grain size | per lot | TiO₂ drift or coarse mineral rise |
| Melt stability | seed count, cord/striae trend | daily | haze rises with cords |
| Redox | FeO/Fe(total) trend proxy + combustion stability | daily | tone drift + haze together |
| Optical QA | Lab*, haze %, T_550 | per shift | L drops while b stays stable |
| Defect ID | microscopy and inclusion ID | weekly or on event | rutile-like crystals or Ti-rich stones |
A strong habit is to set “stop rules.” If haze crosses a line, the plant should not keep running and hope it disappears. Ti-related haze usually grows in the cullet loop if it is not addressed.
Conclusion
TiO₂ reduces transparency mainly through microcrystals and Ti-rich cords, so clarity depends on low and uniform Ti, stable redox, strong melting, and hard QA gates using haze, T_550, and Lab*.
Footnotes
-
A measure of how much light bends in a material; mismatch causes haze. ↩
-
Scattering of light by particles similar in size to the wavelength, causing visible haze. ↩
-
Visible streaks in glass caused by composition differences, leading to optical distortion. ↩
-
Managing recycled glass quality to prevent contamination and defects. ↩
-
A common, stable crystalline form of titanium dioxide that causes haze. ↩
-
Another crystalline form of TiO₂, less stable at high temperatures than rutile. ↩
-
The balance of oxidation states in the melt, affecting color and fining. ↩
-
A standard color space used to measure lightness (L) and color tone (a, b*). ↩