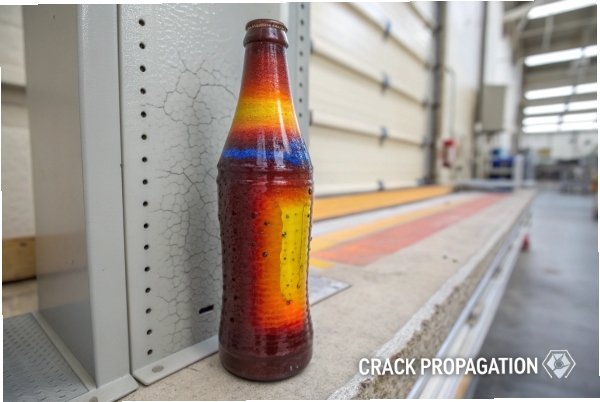
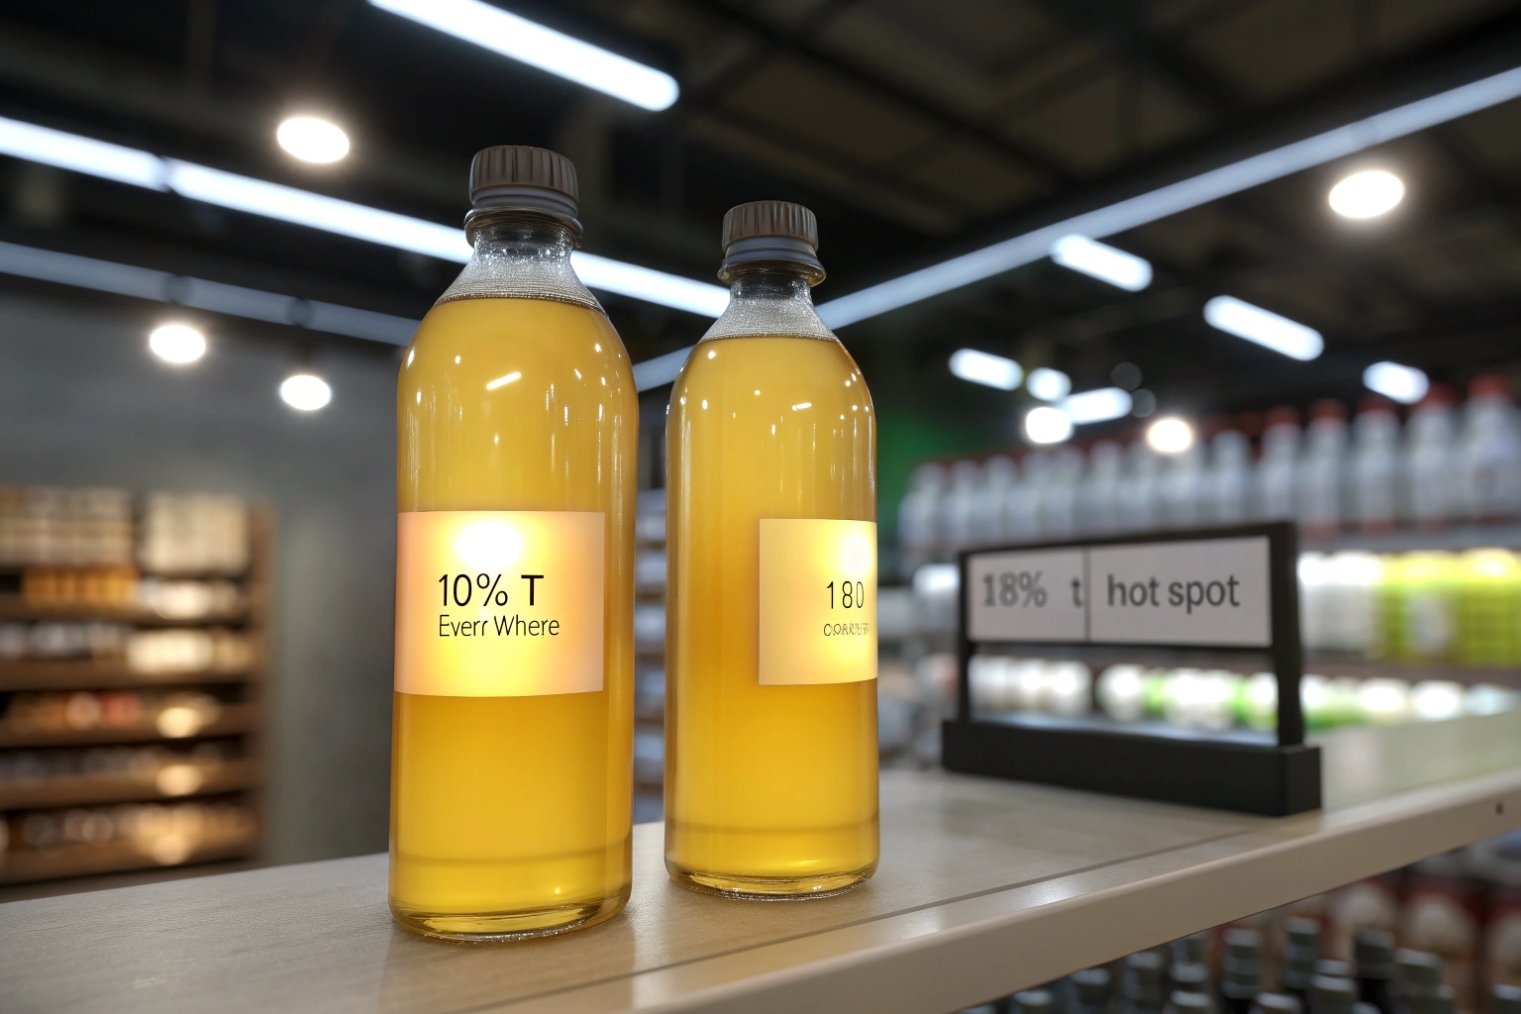
A bottle can look “right” and still fail on shelf. One thin zone can act like a window. That one zone can shorten shelf life without warning.
Uniform light transmission means the bottle does not have local “hot spots” where UV or blue light passes more than the rest of the body. When transmittance is even, product protection stays consistent, and shelf life is easier to control across lots.

Uniform transmission is a thickness-and-color control problem, not a color-name problem
Uniform light transmission sounds like an optical topic, but it starts as a forming topic. Glass color sets the baseline filter. Wall thickness distribution then decides whether the filter is consistent everywhere the liquid sits. Decoration and coatings can help, but they can also hide weak zones. That is why “amber” alone is not a protection spec. The real question is: how much light passes in the sensitive wavelengths at every point on the bottle body.
What “uniform” should mean in a practical spec
A useful definition has three parts: a wavelength band, a bottle zone, and a variation limit.
-
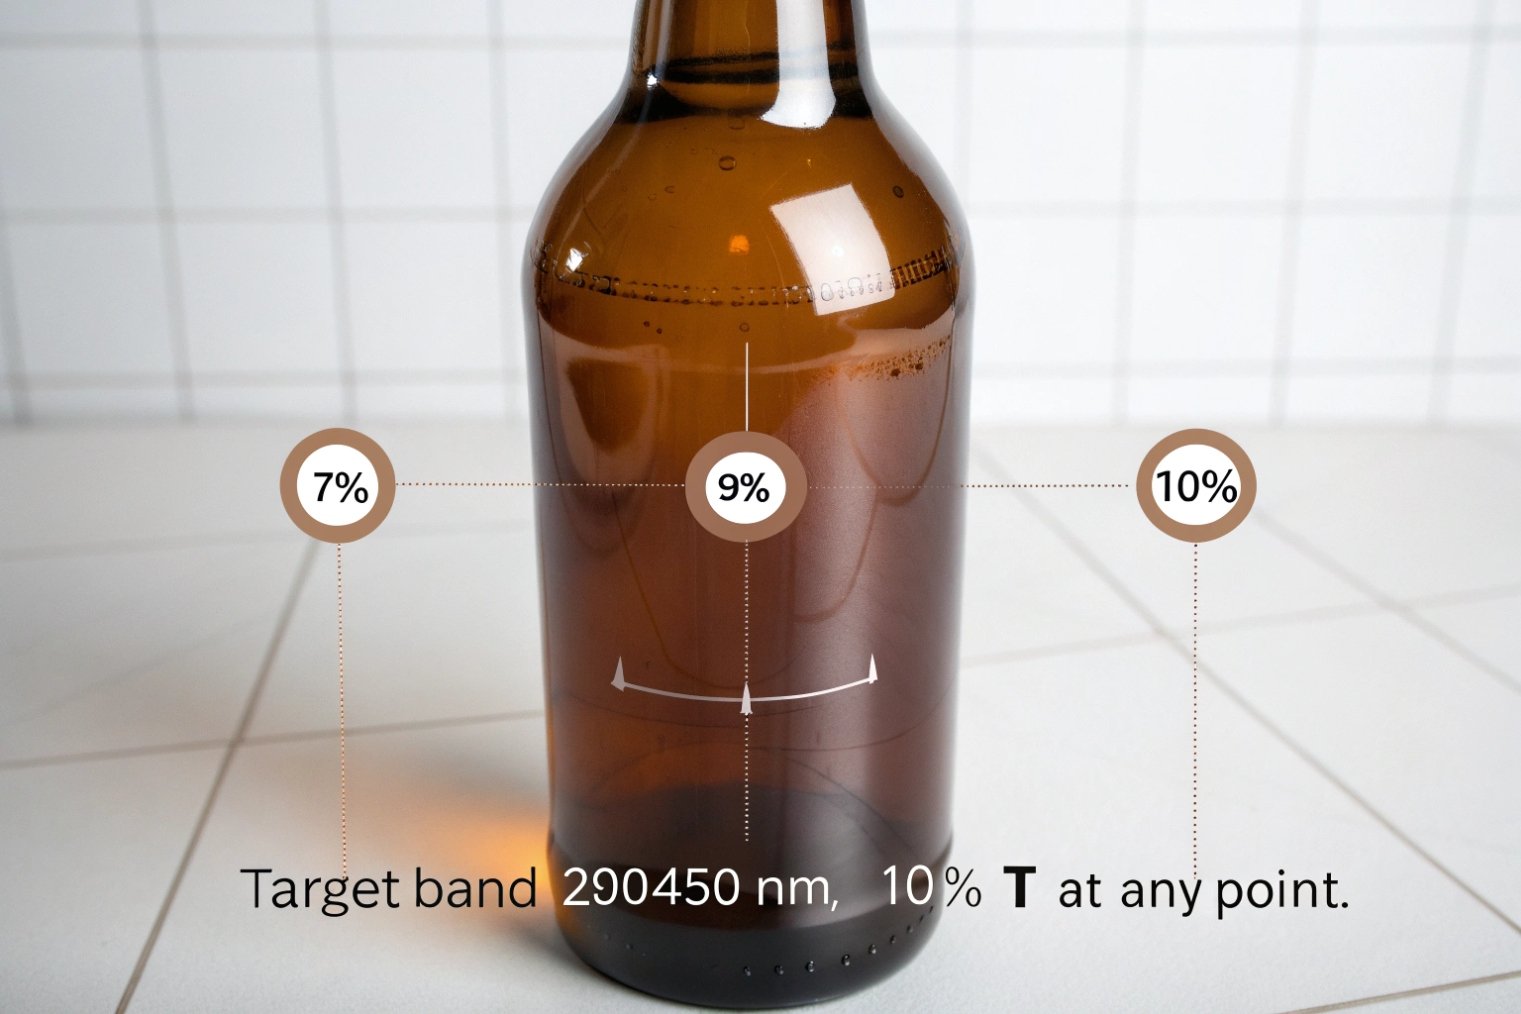
Wavelength band: for many products, the risk wavelength band 1 is UV and short visible. A common internal focus is 290–450 nm or 300–450 nm, because this covers UV-A and the blue region many LEDs emit.
-
Bottle zone: define the “body” area that holds liquid during storage, not the neck finish or heel.
-
Variation limit: define a max allowed spread across points. Some teams use max–min limits. Some use coefficient of variation (CV) to avoid overreacting to tiny absolute differences.
The exact numbers depend on the product. A fragrance oil and a vitamin serum do not share the same tolerance. Still, a structure like the table below keeps decisions clear and keeps supplier discussions calm.
| Metric | Simple definition | Why it helps | Typical internal target (example) |
|---|---|---|---|
| Max hotspot %T | Highest transmittance in band at any point | Catches “one bad window” risk | Hotspot ≤ target limit |
| Spread (max–min) | Hotspot %T minus lowest %T across points | Measures uniformity across body | Spread ≤ 2–5% absolute |
| CV across points | Std dev / mean of %T across points | Scales with the average | CV ≤ 10–15% |
| Thickness spread | Max thickness minus min thickness in body zone | Predicts optical spread | Keep wall variation tight |
Why thickness drives hotspots even in “same color” glass
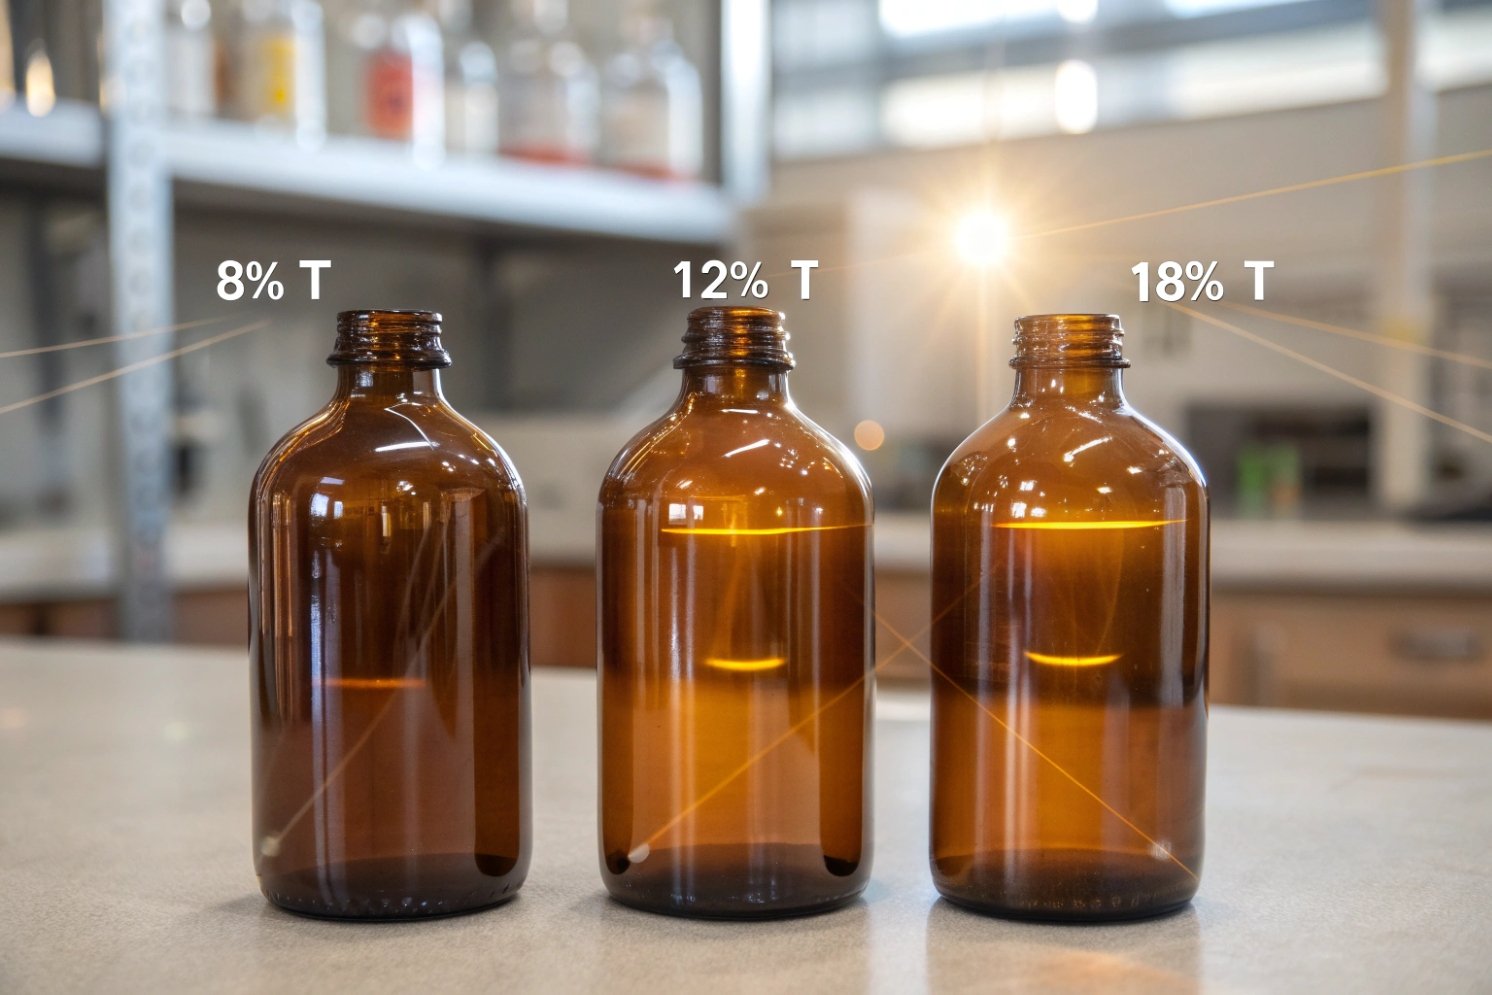
Pigmented glass absorbs light. But absorption scales with path length. If one side wall is thinner, more light passes through, even if the color looks identical to the eye. This is the same reason a thin amber glass 2 coupon can look lighter than a thick amber coupon. In real bottles, wall thickness is never perfectly even. The goal is to keep variation inside a band that does not create meaningful optical weak points.
A simple working checklist that avoids arguments
-
Define the sensitive band (example: 290–450 nm).
-
Define the body zone and measurement grid.
-
Specify uniformity metrics (hotspot, spread, or CV).
-
Tie this to forming controls that reduce thickness drift.
-
Verify on finished bottles, not only flat glass coupons.
That is the foundation. The next sections answer the questions buyers and QC teams ask when they need to turn “uniformity” into a pass/fail decision.
If the bottle will protect the product, the definition must be clear enough that two labs and two factories reach the same conclusion.
What constitutes transmittance uniformity across a bottle’s body?
Uneven protection usually hides in plain sight. The bottle looks uniform in room light. Then one area transmits more UV under store lighting. That is where stability problems start.
Transmittance uniformity across the body means the bottle’s measured %T in the risk band stays within a defined variation limit at all tested points on the liquid-holding area. A uniform bottle has no localized hotspot that exceeds the spec, even if the average looks good.
Define the body zone the product actually uses
Uniformity should focus on the area that is filled and stored. For most bottles, that is the cylinder body plus the lower shoulder. The neck finish, ring, and heel often have different thickness and geometry. Including them can confuse the metric. A practical approach is to define a “measurement window” like this:
-
Top boundary: below the shoulder transition
-
Bottom boundary: above the heel curve
-
Left/right: full wrap, sampled by angles
Use a measurement grid that matches risk
A grid turns opinions into data. A simple grid is 3 heights × 6 angles (18 points). Higher-risk products can use 4 heights × 8 angles (32 points). The key is repeatability. The same grid should be used for PPAP samples and for incoming QC checks.
Choose a uniformity metric that fits decision-making
There is no single global standard for “uniformity” because products differ. Still, these metrics work well in practice:
| Uniformity metric | How to calculate | Best for | Weakness |
|---|---|---|---|
| Hotspot limit | Highest %T in band must be ≤ limit | High-risk formulas | Needs a good grid |
| Max–min spread | Max %T minus min %T across grid | Simple supplier control | Ignores where hotspot is |
| CV across points | Std dev / mean across grid | Comparing batches fairly | Less intuitive for teams |
| Weighted risk index | Weighted by action spectrum of product | High-end validation | Needs more modeling |
Treat decoration zones separately
If there is a clear window, a partial spray, or a label cutout, it is not fair to average those points with fully covered points. Those zones should be tested as separate categories. A uniformity spec that mixes covered and uncovered areas can pass “on paper” while still creating real hotspots.
A strong definition is simple: measured %T in the chosen band stays within the allowed limits across a defined grid on the liquid-holding body. When that definition is written into the spec, uniformity becomes measurable and enforceable.
Why does uniformity matter for consistent product protection?
A single hotspot can ruin the whole bottle’s protection story. The product does not degrade evenly. It degrades where light reaches it most, and then the changes spread through the liquid over time.
Uniformity matters because product protection is limited by the weakest point. A local hotspot can expose part of the product to higher UV or blue light, which drives faster oxidation, fading, and active loss. Uniform bottles reduce lot-to-lot shelf-life swings and lower complaint risk.
The “weakest point sets the shelf life” effect
If 95% of the bottle blocks light well but 5% acts like a window, the product is still at risk. Light-driven reactions can start near the hotspot. That local change can shift smell, color, or clarity first. Then mixing during handling spreads the changed components. The customer does not care that most of the bottle was good. The customer sees the defect.
Uniformity reduces batch-to-batch surprises
Many brands run stability tests on pilot bottles, then scale to volume. If uniformity drifts in mass production, stability results stop matching reality. That leads to expensive rework:
-
sudden need for cartons or sleeves
-
relabeling shelf-life dates
-
reformulation pressure
-
returns and negative reviews
Uniformity also protects brand consistency. Even when the product is stable, visible differences such as color shift can still harm trust. A uniform bottle helps avoid “this batch looks different” complaints.
Uniformity supports simpler packaging decisions
If the bottle is uniform, the brand can make cleaner choices about secondary packaging. With non-uniform bottles, brands often add cartons as an emergency fix. Cartons work, but they add cost and reduce shelf visibility. A uniform bottle lets the team choose cartons for marketing or sustainability reasons, not as a rescue plan. For sensitive fragrance oil 3 products, ensuring that no oxidation 4 occurs due to light leaks is vital for aroma integrity.
| Business impact | What non-uniformity causes | What uniformity prevents |
|---|---|---|
| Shelf life | Local accelerated degradation | Stable, predictable shelf life |
| Quality costs | Claims, rework, urgent packaging changes | Fewer surprises and fewer returns |
| Brand trust | Visible drift between batches | Consistent appearance over time |
| Supply chain | More incoming disputes | Clear pass/fail criteria |
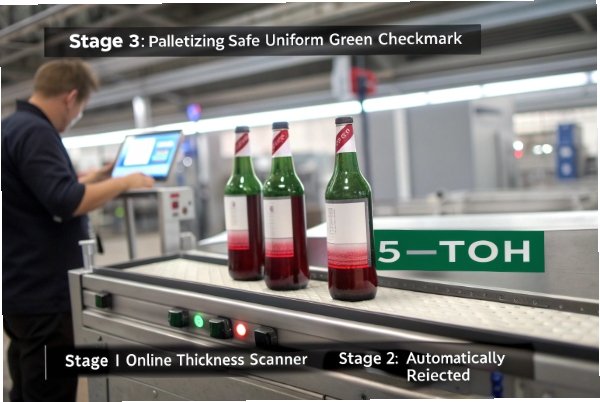
Which inspection methods map hot spots in finished bottles?
Hotspots are not obvious with normal lighting. The only reliable way is to measure finished bottles under a controlled method that can reveal local differences.
Hotspot mapping uses a point-by-point measurement across a defined grid on the bottle body. Common methods include UV-Vis spot testing with fixtures, scanning spectrophotometer mapping, backlight imaging for relative uniformity, and thickness mapping that correlates with optical risk.
Method 1: UV-Vis spectrophotometer mapping (most direct)
This is the clearest method for true transmittance. A fixture holds the bottle and measures %T at chosen points. Some labs measure a full spectrum at each point. Others focus on key wavelengths (example: 365 nm for UV-A and 450 nm for blue). The output can be a heat map of hotspot risk.
Best use: qualification, supplier comparison, periodic audits.
Limit: slower, needs fixtures and trained handling.
Method 2: Handheld UV radiometer spot checks (fast screening)
A UV source on one side and a sensor on the other can screen for hotspots. It does not replace full spectral curves, but it is fast for incoming checks when the band of concern is known.
Best use: incoming QC screening and lot release.
Limit: narrower wavelength focus, needs stable geometry.
Method 3: Vision-based backlight imaging (relative uniformity)
A controlled light panel behind the bottle and a camera can detect relative brightness differences. With the right setup, the system can flag thin zones. It is not full spectral transmittance, but it correlates strongly with wall thickness and pigment density.
Best use: high-speed sorting, 100% inspection.
Limit: needs calibration and correlation to real %T.
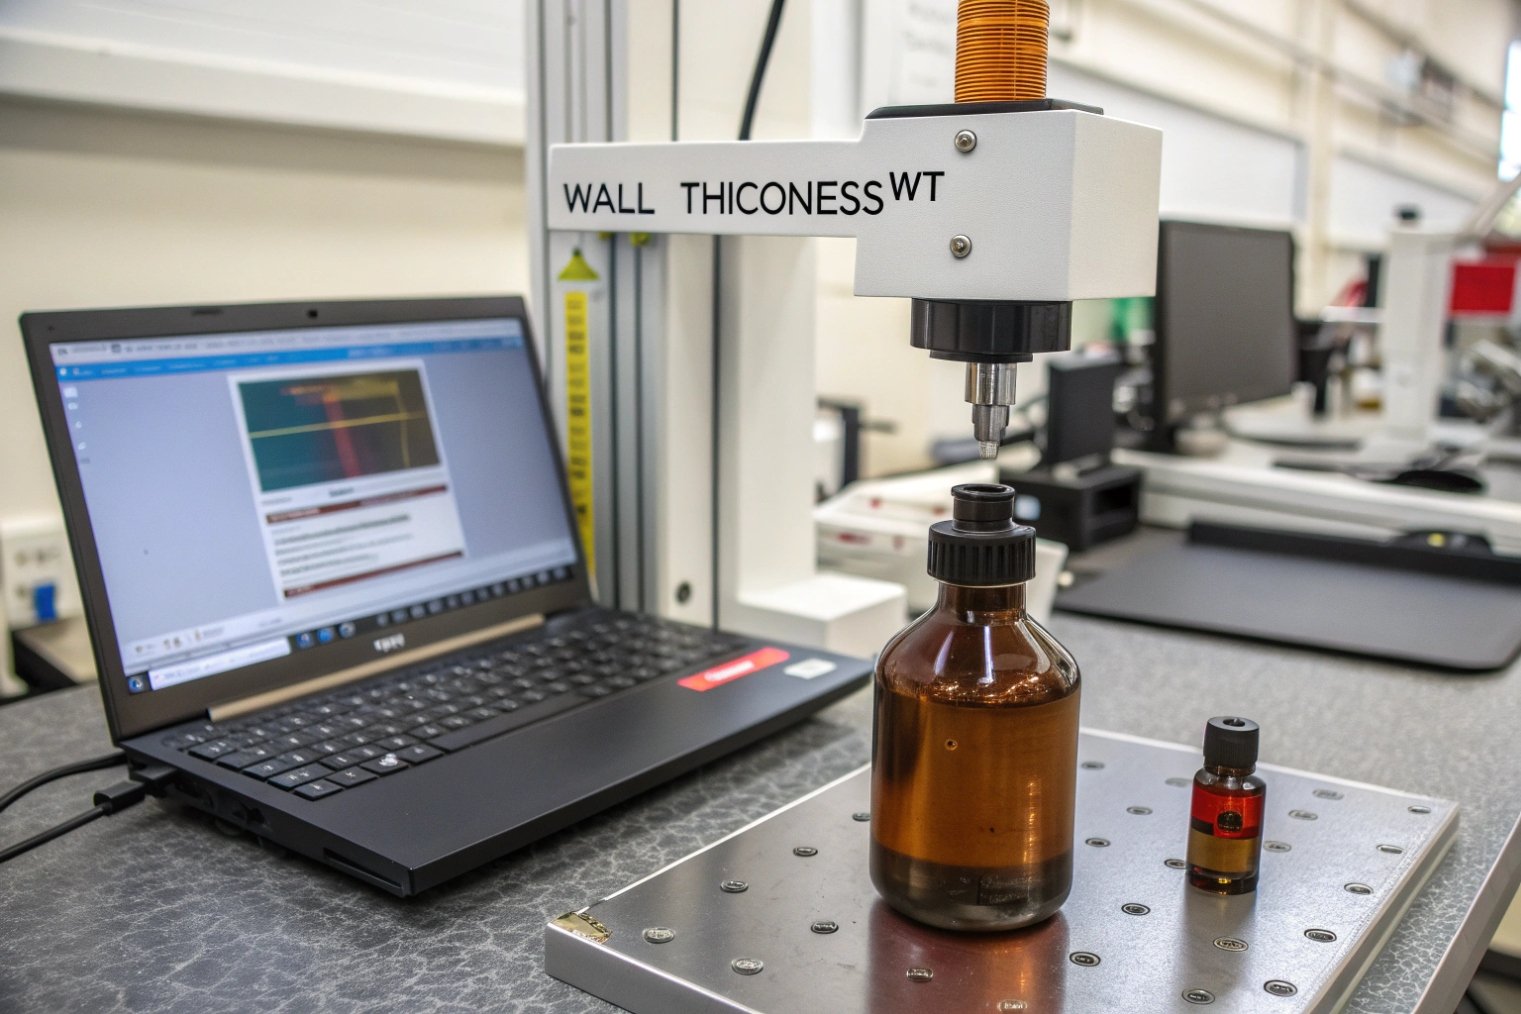
Method 4: Thickness mapping (predicts hotspots)
Ultrasonic thickness gauges can map wall thickness 5 around the body. Since thickness drives transmission, thickness maps can predict where hotspots may occur. This method is powerful when paired with an optical model or with baseline correlation data using a spectrophotometer 6 for precision.
Best use: process control and root cause analysis.
Limit: thickness is a proxy, not the final optical proof.
Will AI vision systems predict uniformity from forming parameters?
Many plants want to move from “find defects after forming” to “prevent defects during forming.” AI can help, but only when the inputs and labels are strong.
AI can predict transmittance uniformity risk when it learns the relationship between forming parameters, wall thickness distribution, and measured hotspot maps. It works best as a risk predictor and process alarm, not as the only compliance proof, because drift in molds, glass chemistry, and cameras can break the model without warning.

What parameters can carry real signal
Uniformity is driven by thickness and pigment consistency. Thickness is driven by forming stability. So the model inputs that often matter are:
-
gob weight and temperature
-
feeder timing and cut-off consistency
-
blank and blow pressures and timing
-
mold temperature and cooling balance
-
machine speed and shear conditions
-
swirl, settle, and parison formation behavior
On top of that, cameras can observe visible cues such as parison shape, glass distribution, and final bottle brightness under controlled backlight. Utilizing advanced AI vision systems 7 allows for real-time monitoring of these complex variables.
What AI can do well in real production
AI is strong at pattern detection across many variables. It can:
-
predict which machine settings raise hotspot risk
-
flag drift before out-of-spec bottles appear
-
suggest parameter ranges that reduce thickness spread
-
rank cavities or molds by risk over time
This is most valuable when the system closes the loop with engineers. A model that only “scores” bottles but does not drive action becomes noise.
Conclusion
Uniform transmission comes from clear metrics, stable thickness control, and hotspot mapping on finished bottles. Fast screening plus periodic spectral audits keeps protection consistent across every lot.
Footnotes
-
Detailed overview of the electromagnetic spectrum and its various wavelength bands. ↩ ↩
-
Understanding the photoprotective properties of amber glass in packaging. ↩ ↩
-
Research on the stability of fragrance oils when exposed to environmental factors. ↩ ↩
-
Scientific explanation of oxidative degradation in light-sensitive products. ↩ ↩
-
Guide to glass wall thickness and its impact on container durability. ↩ ↩
-
Technical background on spectrophotometry for measuring light transmission. ↩ ↩
-
Insights into AI vision technology for quality control in smart factories. ↩ ↩