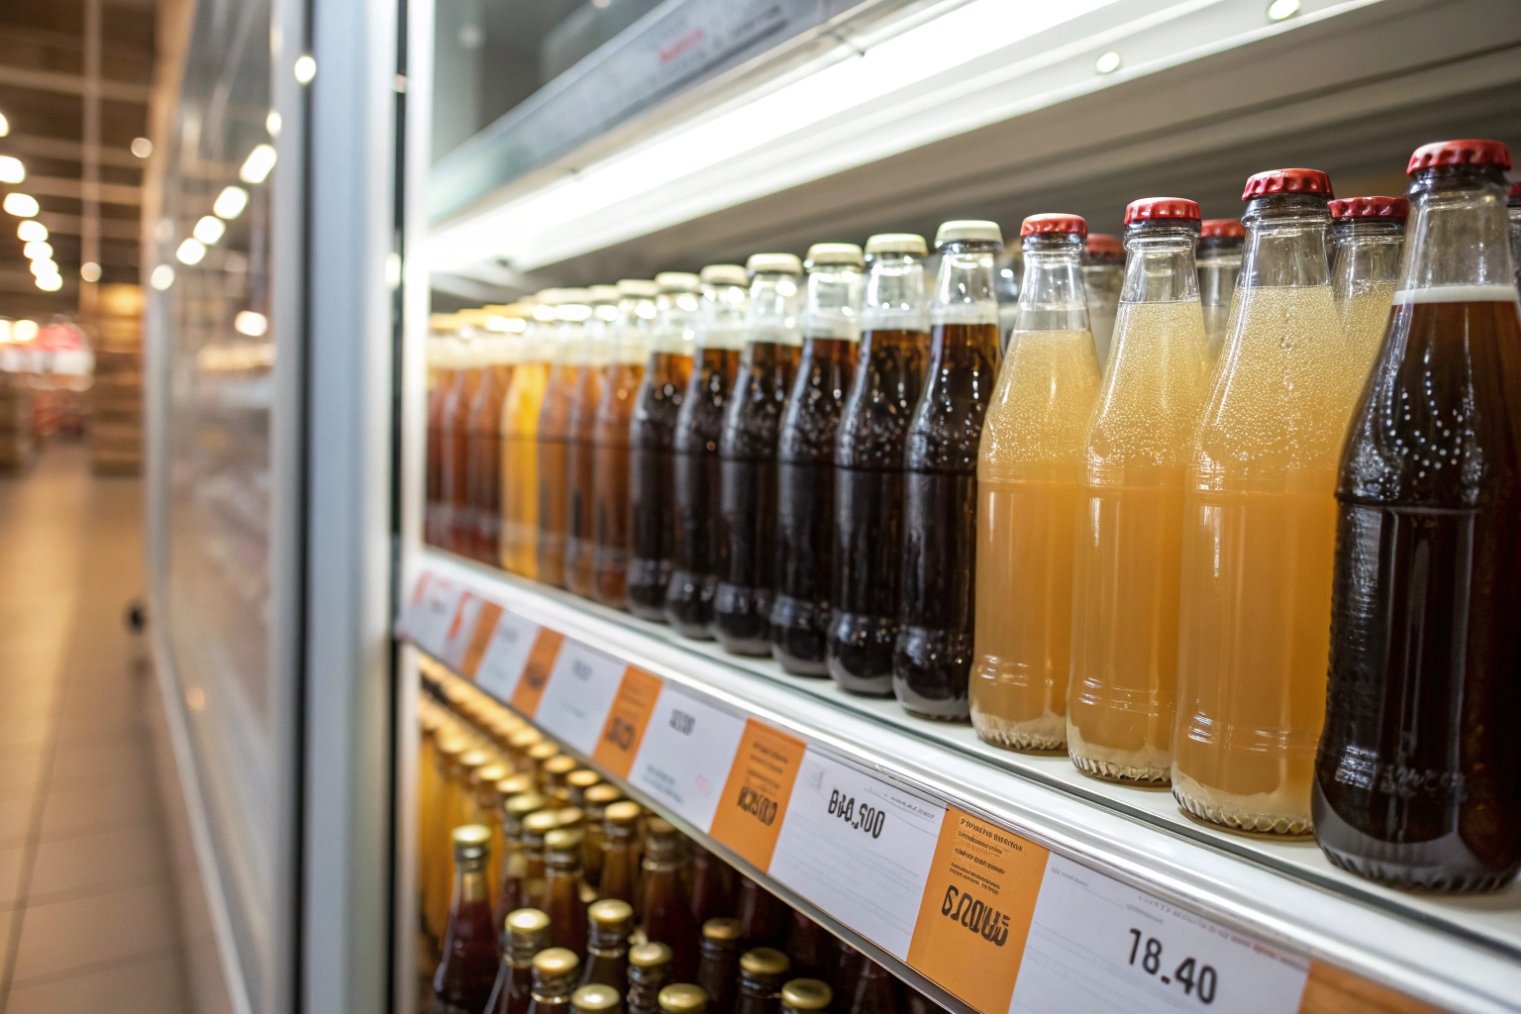
Most buyers talk about “clear”, “green” or “amber” glass, but light does not speak that language. It sees a spectrum, and your product sees the damage.
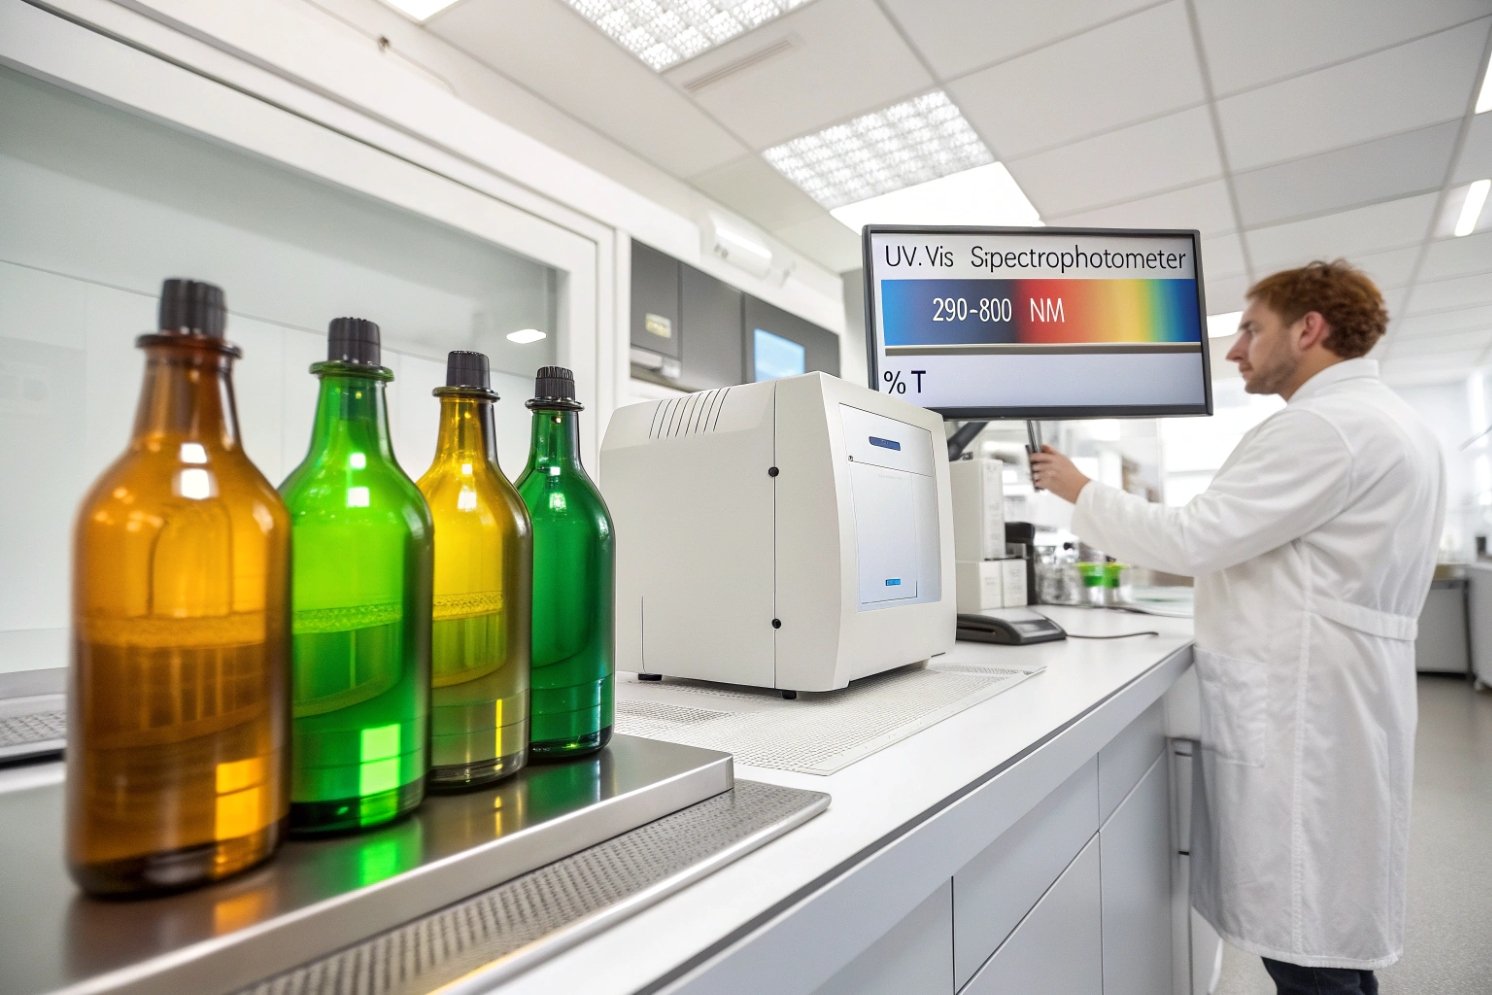
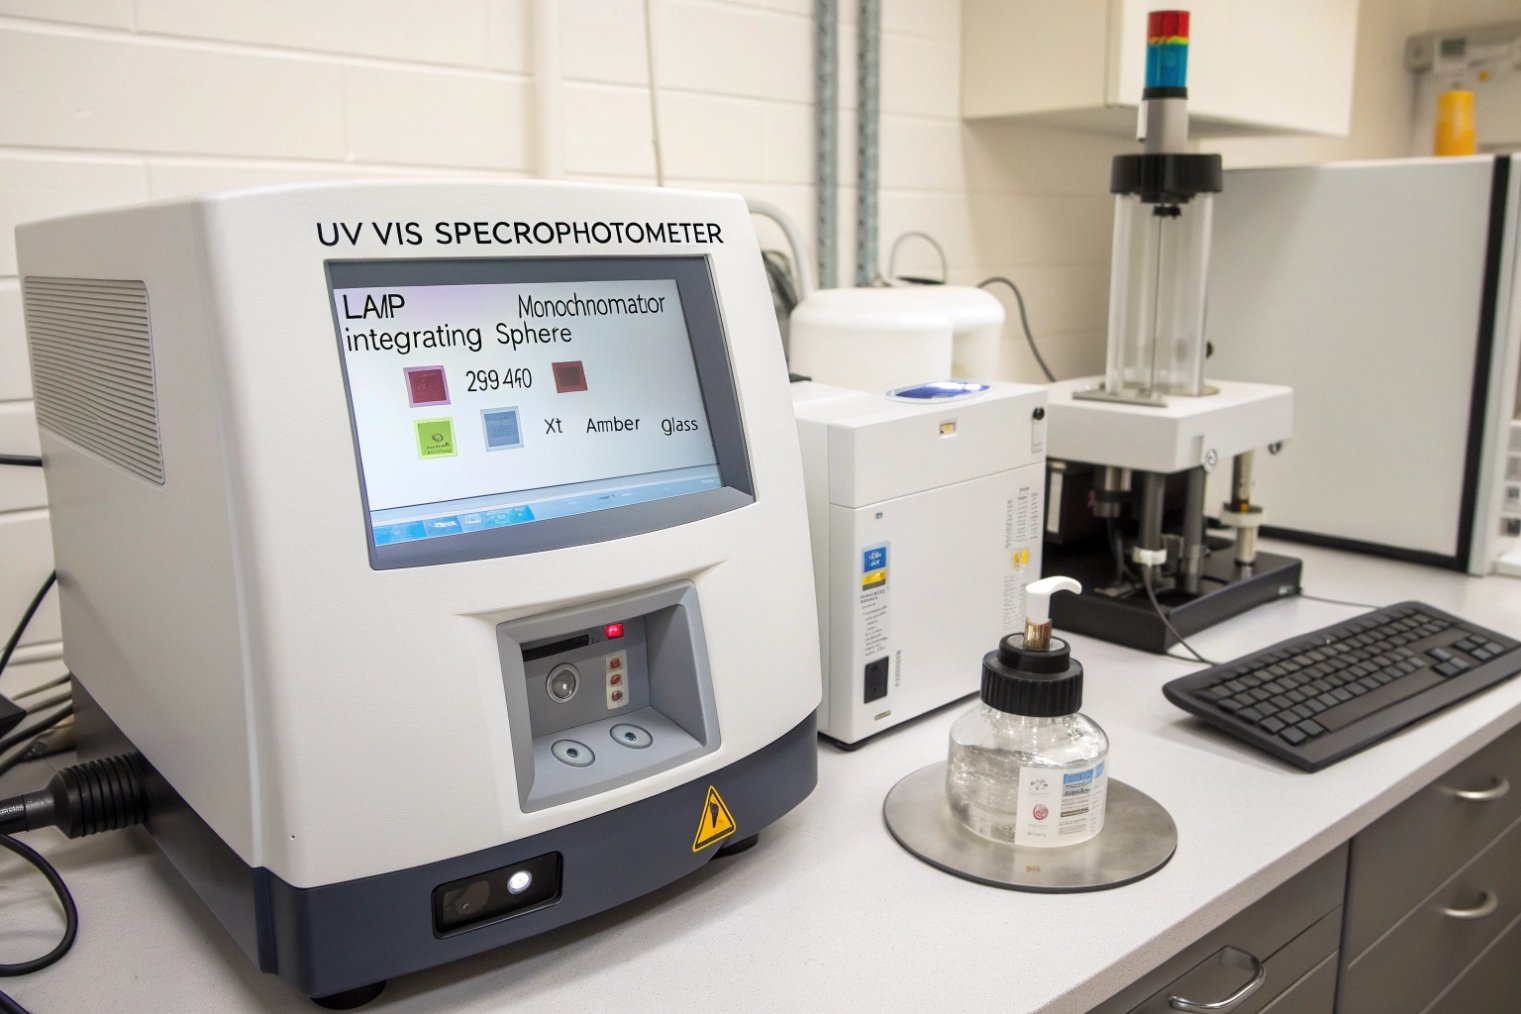
Glass bottle transmittance is how much light passes through the glass at each wavelength. In B2B testing, we measure it with UV–Vis spectrophotometers to prove light protection, product stability and compliance.

On a spec sheet, this shows up as a spectral transmission curve or a small table of %T between 290–450 nm. Behind that simple line is a full test method, several standards, and more risk than many buyers realize. When we treat transmittance as a real performance metric, we move beyond “amber-looking” glass into quantifiable light protection.
In practice, most suppliers validate this using UV–Vis spectrophotometer scan methods for packaging containers 1 so the result is auditable, comparable, and tied to real wavelength bands.
What does transmittance mean for packaging glass in B2B testing?
Many teams see “spectral transmission” in a report and skip the graph. That is a missed chance, because that curve is the most honest description of how your bottle interacts with light.
For packaging teams, transmittance is the percent of UV and visible light that gets through the bottle. It turns vague color names like “amber” into measurable light-blocking performance curves.
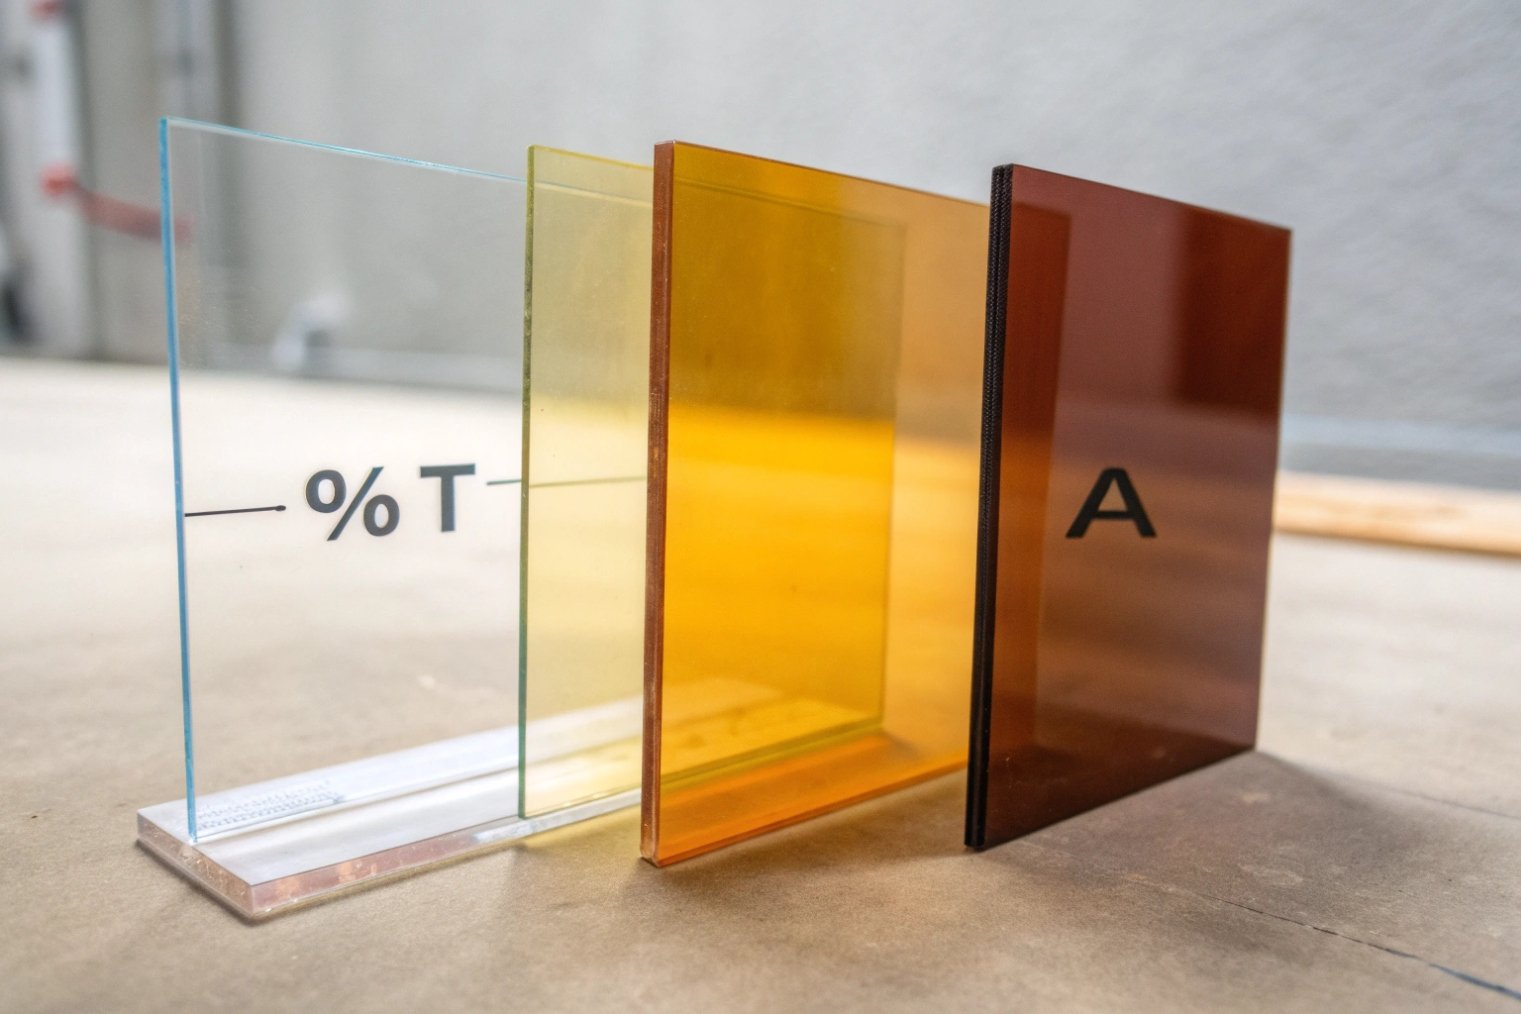
From %T to absorbance: the basic language
In UV–Vis testing, the instrument compares the light intensity before the bottle ((I_0)) with the light after the bottle ((I)). Transmittance is:
[
T = \frac{I}{I_0}
\quad\Rightarrow\quad
\%T = \frac{I}{I_0} \times 100
]
Absorbance is then calculated as:
[
A = -\log{10}(T) = -\log{10}\left(\frac{\%T}{100}\right)
]
This aligns with the IUPAC definition of absorbance 2.
In practice, the spectrophotometer is first set to 100% T with air or a reference in the beam. Then a bottle wall is placed in the beam, and the instrument records %T and A across the selected wavelength range.
What a transmittance curve really tells us
For packaging glass, we care about how much energy in “harmful” wavelength bands reaches the product:
- For many drugs and vitamins: 290–450 nm (UV-A + violet).
- For wine and beer: roughly UV-A and violet light (320–440 nm) 3, where light-struck reactions occur.
Regulators use this idea in their definitions of “light-resistant container”. USP and Ph. Eur. chapters for packaging glass and plastics require spectral transmission tests over 290–450 nm and set maximum limits, often “not more than 10% transmission at any wavelength” in that range for light-protective containers.
So, in B2B testing, transmittance is not just an optical curiosity. It is the bridge between:
- Product degradation mechanisms
- Glass color and thickness
- Formal regulatory categories (“light-resistant”)
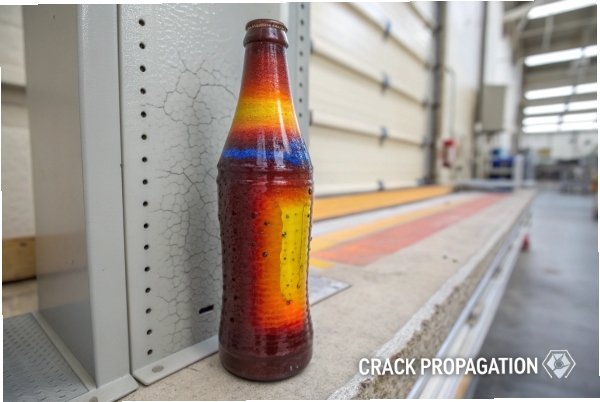
How color, composition and thickness change transmittance
Glass that looks only slightly darker to the eye can behave very differently under UV. Studies on wine bottles show: clear flint bottles can transmit more than 30% of harmful UV–violet light, while dark amber bottles may let through well under 1%.
From a B2B standpoint:
| Design lever | What we change | Effect on transmittance |
|---|---|---|
| Glass colorants | Add Fe, Co, Cr, Ti, etc. to create amber/green | Strong cut in UV and violet light |
| Glass composition | Soda-lime vs borosilicate, extra UV absorbers | Finer control of UV cutoff edge |
| Wall thickness | Thicker walls or bases | Lower %T at all wavelengths |
| Surface coatings | UV-absorbing or reflective coatings | Extra blocking in specific bands |
Because bottle walls are not uniform, transmittance is measured at several points (body, shoulder, neck, sometimes base). Methods described in studies may weight these positions according to real shelf exposure, so the final result reflects actual product risk rather than a single “lucky” thin spot.
In short, in B2B testing transmittance is the numerical version of “how much light does this bottle really let in where it matters?”
Why should buyers quantify bottle transmittance for product stability?
Many buyers rely on a color name and a supplier promise that “this is our standard amber.” That works until one lot runs a bit light and a sensitive SKU starts to fail stability.
Quantifying transmittance links glass color and thickness directly to shelf life. It gives buyers a numeric guardrail against photo-oxidation, flavor change and API degradation, instead of hoping that “amber enough” is good enough.
Light is a real degradation pathway, not a minor detail
Light-sensitive drugs, vitamins, essential oils, beer, and white wine can all degrade when exposed to UV and short-wavelength visible light. Reactions include:
- API breakdown and potency loss
- Color shifts or turbidity
- Off-odors and “light-struck” flavors
Spectral transmission tests on pharma containers are now standard in qualification programs, because they show whether packaging gives enough protection for the labeled shelf life.
Wine research shows just how big the effect can be. In situ measurements inside real bottles exposed to store lighting find that clear bottles allow enough 320–440 nm light to damage wine quickly, while dark amber bottles can protect quality for much longer on shelf.
Turning risk into a quantifiable specification
This is where buyers benefit from real numbers. A simple spec can look like:
- “Spectral transmission 290–450 nm: ≤10% at any wavelength” for oral liquids, in line with pharmacopoeial expectations.
- Stricter limits (≤2–3% in certain bands) for very light-sensitive SKUs.
Because wall thickness and color can vary around a bottle, good methods:
- Measure several positions (body, shoulder, neck).
- Use representative cut-outs or holders when whole-bottle geometry is hard to measure.
- Report both the worst-case %T and a weighted average based on actual exposure.
This makes it possible to link container spec, light-exposure scenario, and expected shelf life in a clear way.
Business value: fewer surprises and better supplier control
From a B2B point of view, quantified transmittance helps in at least three ways:
| Risk scenario | What can go wrong | How transmittance data helps |
|---|---|---|
| New SKU in a “nice” clear bottle | Fast color change or off-flavor on shelf | Shows early that clear glass is under-protective |
| Colorant or furnace drift at supplier | “Washed-out” amber lot reaches filler | Flags out-of-spec %T before product is filled |
| New light-intense merchandising | Extra display lighting shortens shelf life | Lets you model impact of lighting vs. current glass |
In short, when buyers demand transmittance data, they reduce the gap between lab stability studies and real-world display conditions.
Which standards and instruments measure bottle transmittance accurately?
Most labs know how to run UV–Vis tests, but packaging glass needs a specific configuration. Curved walls, scattering, and strict pharmacopoeial limits all make the setup more than a basic cuvette measurement.
Standards such as USP and Ph. Eur. define spectral transmission limits between 290–450 nm, while UV–Vis spectrophotometers with integrating spheres and dedicated bottle holders deliver reproducible, audit-ready transmittance curves across that range.
Key standards buyers will see in reports
Several documents show up again and again in spectral transmission test reports:
- USP <671> Containers – Performance Testing (USP <671> Revision Bulletin 4)
- USP <660> Containers—Glass and Ph. Eur. 3.2.1 Glass containers for pharmaceutical use (the Ph. Eur. method is often circulated as a lab reference, e.g., Ph. Eur. 3.2.1 spectral transmission method excerpt 5)
- Company or ASTM-type methods for general glass and ceramics, which often follow similar UV–Vis principles and acceptance criteria.
When a lab says “USP spectral transmission”, they usually mean a UV–Vis scan every 10–20 nm between 290 and 450 nm, with a pass/fail check against those limits.
How a UV–Vis setup for bottles actually works
At the heart is a UV–Vis spectrophotometer that can deliver stable light and good signal-to-noise in low-transmittance samples. A typical workflow looks like this:
- Baseline / reference
The instrument is zeroed with air or a reference to set 100% T across the range. - Sample positioning
A bottle section, whole bottle, or vial is placed in the beam using solid-sample holders, bottle/vial fixtures, or custom jigs. - Scan 290–450 nm
The instrument records %T at fixed intervals (often 1–20 nm steps) and converts to absorbance as needed. - Evaluate against limits
Software applies USP/Ph. Eur. criteria and flags pass/fail, sometimes automatically for QC batches.
Because bottles are curved and scatter light, many setups use an integrating sphere accessory for UV–Vis solid samples 6. This collects both direct and scattered transmitted light so the reading reflects total transmission, not just the narrow core of the beam.
Handling curved bottles, small vials, and routine QC
Not every bottle can sit perfectly normal to the beam. To keep results meaningful:
- Labs often cut circular panels from the sidewall and mount them flat in the integrating sphere.
- Specialized vial/bottle holders keep standard diameters aligned and repeatable, especially when many SKUs share a format.
- The spectrophotometer is regularly checked with certified transmission standards so very low-transmission amber bottles can be distinguished from out-of-spec lots with confidence.
A simple way to picture the lab setup:
| Step | What happens | Why it matters |
|---|---|---|
| Baseline | Air or reference set to 100% T | Defines the “no glass” condition |
| Sample mounting | Bottle wall or cut-out fixed in beam | Ensures repeatable path length and geometry |
| Spectral scan | 290–450 nm at defined intervals | Captures full risk band for light-sensitive products |
| Data handling | Max %T and curve vs. limits | Makes a clear pass/fail for B2B specifications |
With this structure, transmittance numbers become defendable in audits, not just “lab folklore” that someone once measured.
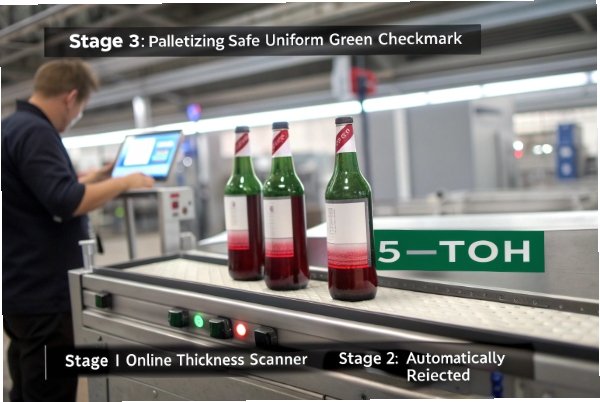
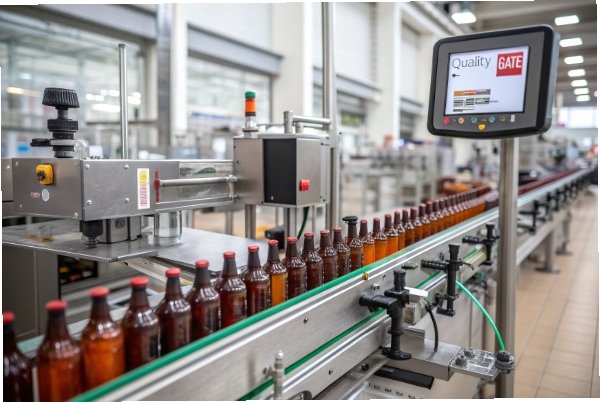
How are inline optical sensors improving transmittance QC at scale?
Traditional spectral transmission tests are slow and destructive. Great for method development and incoming inspection; not great for catching furnace drift on a fast glass line in real time.
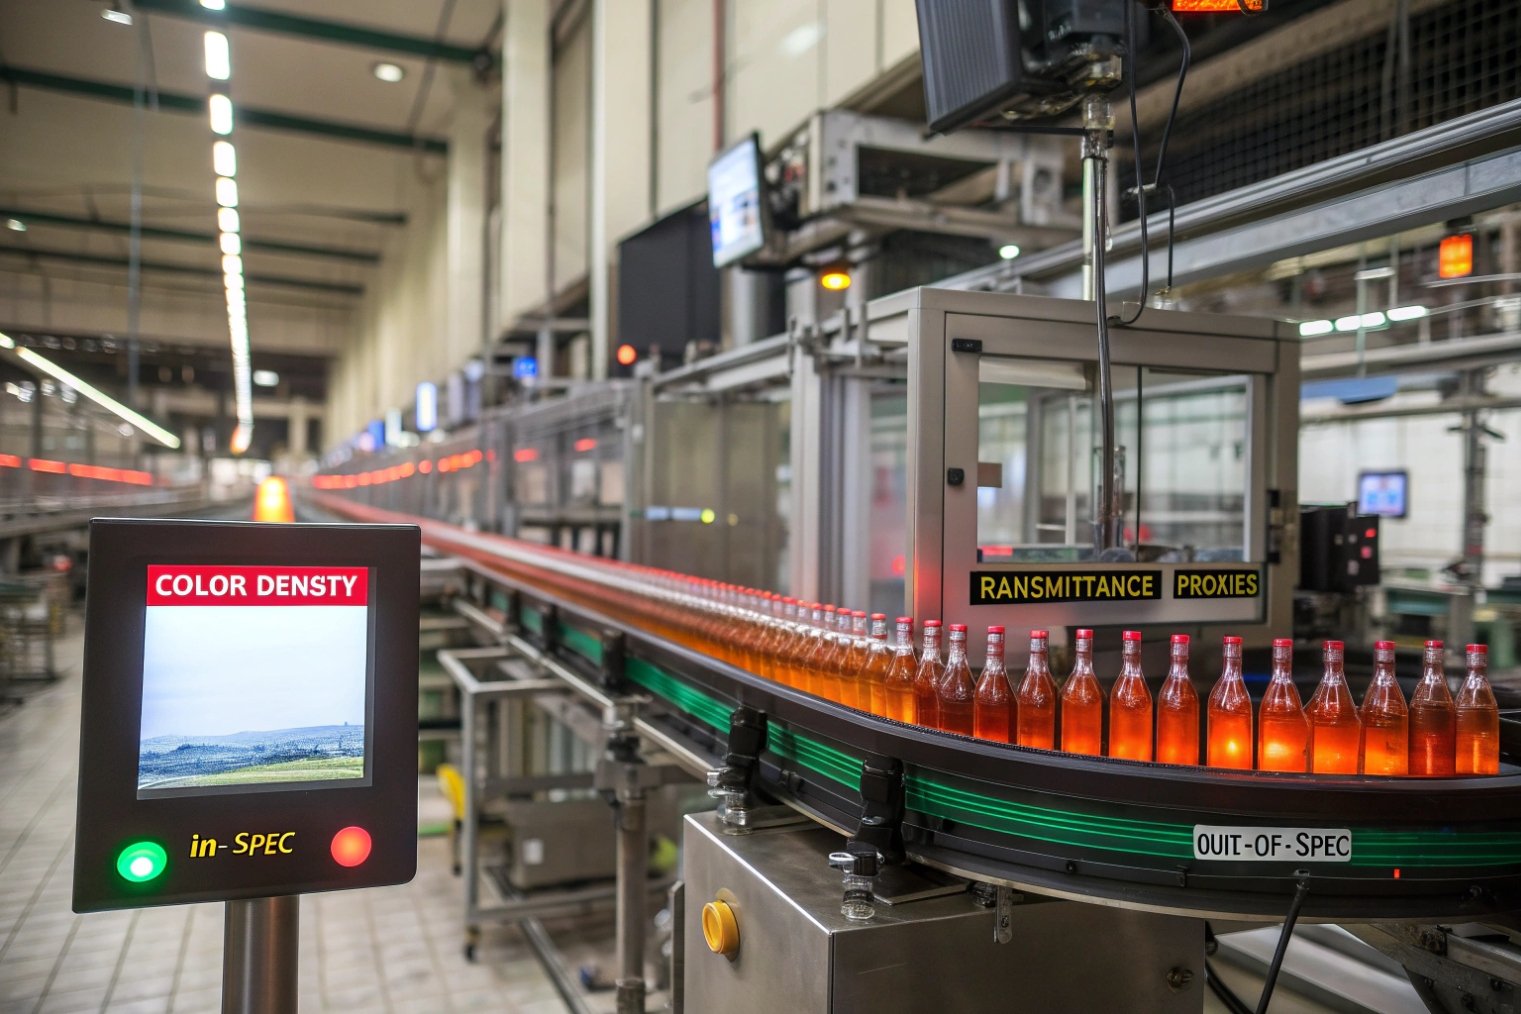
Inline optical sensors bring the same transmittance logic onto the production line. They combine high-speed cameras or photodiodes with LEDs to flag out-of-spec color density and transparency on every bottle, not just lab samples.
From offline sampling to continuous monitoring
Most plants still pull periodic samples, cut out panels, and send them to a central lab for UV–Vis. That means:
- Only a tiny fraction of bottles are checked
- Furnace or colorant drift can go unnoticed for hours
- Data arrives too late to save product already filled
Inline systems do not replace the UV–Vis lab, but they watch every bottle for changes that correlate strongly with transmittance: apparent color density, wall thickness and optical defects.
Types of inline optical solutions now in use
On today’s lines, you see several layers of optical QC:
- Vision-based container inspection systems
Suppliers like Bucher Emhart Glass offer inline inspection for glass containers 7 that uses controlled lighting and software to verify color and defects at full line speed. - Inline transparency / appearance analyzers
Camera-based systems quantify transmitted image sharpness and contrast to describe “perceived transparency” in real time. - Thickness and geometry sensors
Confocal and chromatic sensors measure hot-end or cold-end wall thickness and base thickness inline. Since thickness is a key driver of %T, these measurements act as a strong proxy for transmittance stability. - Smart photoelectric sensors for transparent objects
Sensors tuned for clear glass can reliably detect the presence, position, or basic opacity of bottles even when they are almost invisible to standard devices.
These tools do not all output “%T at 320 nm,” but they provide continuous indicators that link closely with the same optical properties that the lab quantifies more precisely.
Bringing plant-floor optics and lab UV–Vis together
The most robust QC strategy uses inline sensors and lab instruments together:
| Technology | What it measures in real time | How it supports transmittance QC |
|---|---|---|
| Inline thickness sensors | Wall and base thickness | Controls one of the main drivers of %T |
| Vision color / appearance | Apparent intensity and color of glass | Detects colorant drift that would change transmittance |
| Inline transparency analyzers | Clarity / image sharpness through glass | Correlates to overall transmitted light in visible range |
| Lab UV–Vis with sphere | True spectral %T 290–450 nm | Calibrates models and confirms compliance vs. standards |
In many plants, process engineers build simple correlations between inline readings and lab %T curves. If a certain shift in camera intensity maps to a few percent change in UV transmission, they can set line alarms around that, long before product falls out of spec.
The result is practical: fewer bad lots, faster response to furnace or colorant drift, and a much stronger story for customers who ask, “How do you make sure every bottle matches the spectral transmission we qualified?”
Conclusion
When we treat transmittance as a measurable, spec-driven property, glass bottles become predictable light shields, not just colored shells, and both product stability and B2B trust improve.
Footnotes
-
Shows a practical UV–Vis workflow for spectral transmission testing of packaging containers. ↩︎ ↩
-
Clarifies the formal definition of absorbance and how it relates to transmittance in spectroscopy. ↩︎ ↩
-
Explains why 320–440 nm light is especially damaging for wine under retail lighting. ↩︎ ↩
-
Provides the USP chapter bulletin context commonly referenced for spectral transmission and packaging performance requirements. ↩︎ ↩
-
Gives the practical Ph. Eur. 3.2.1 spectral transmission method details labs use for 290–450 nm reporting. ↩︎ ↩
-
Explains integrating spheres and why they improve transmission measurements for curved or scattering solid samples. ↩︎ ↩
-
Describes inline inspection systems used to monitor glass container color/defects at production speed. ↩︎ ↩