Coating defects often look “cosmetic”, but they destroy line efficiency, label quality, and brand feel. If uniformity is not measured, it turns into customer complaints very fast.
To test coating uniformity on glass, combine quick visual checks with measured data: film weight, thickness, gloss, color, slip, and adhesion. Then lock this into an SPC plan with clear limits and reaction rules.

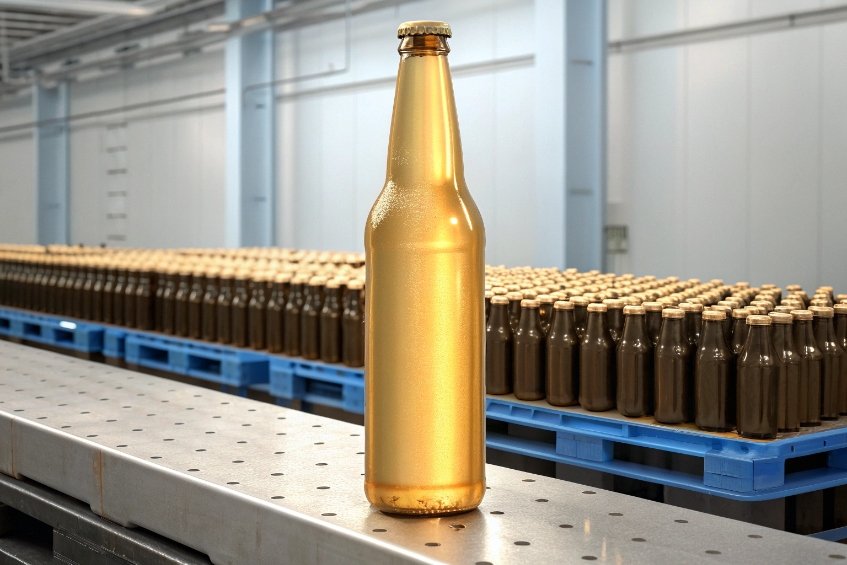
The goal is simple: every bottle in the pallet should behave like the “golden sample”. That means the same look, the same friction, the same resistance to scuffing and washing. To reach this, testing must move from “look and guess” to a structured system: what to measure, where to measure, how often to measure, and when to stop the line.
Which basic methods work best for coating uniformity?
There is no single “perfect” test. Thin SiOx, thick organic varnish, and cold-end PE all need different tools. So the first step is to build a toolbox, then choose the right tool for each layer.
Visual checks still matter, but they are only the first filter. Real control comes from numbers: g/m², gloss units, ΔE, μm, COF.

From eyeball checks to measurable data
A simple, robust test chain for bottles can look like this:
-
Visual and backlit rotation
Hold or fixture the bottle under strong white light and rotate it. Backlighting reveals:- Streaks, bands, and cloudiness
- Skips, holidays, pinholes
- Overspray edge lines and sagging zones
This is fast and cheap. It should be part of 100% inspection, manual or automatic.
-
Gravimetric weight-per-area (g/m²) 1
Two main approaches:- Use witness coupons: coat flat glass coupons that travel through the same spray/curtain. Weigh before and after.
- Strip-and-weigh on bottles: strip a defined area (or full bottle) with a suitable solvent or etchant, then measure mass loss.
This gives a direct film weight. It works well for cold-end coatings, organic varnish, and some sol–gels.
-
Thickness mapping
For thin, technical coatings (hot-end Sn, SiOx, Al₂O₃):- Ellipsometry or reflectometry on flats or coupons.
- XRF energy-dispersive X-ray fluorescence analysis 2 / eddy-current mapping if the layer is conductive or has a marker element (Sn, Si, Al, Ti, etc.).
For thicker organics, magnetic or ultrasonic gauges (on coupons or bottle panels) can work.
-
Gloss and haze meters
Measure gloss using the ASTM D523 specular gloss method 3 at a defined angle (often 60° for bottles) on:- Body panel
- Shoulder
- Neck or finish (if coated)
Haze tells how much light scatters. Together they show how uniform the microtexture and film build are.
-
*Spectrophotometric color mapping (Lab)*
Use the [CIELAB (Lab) color space and ΔE tolerance](https://www.xrite.com/-/media/xrite/files/whitepaper_pdfs/l10-001_a_guide_to_understanding_color_communication/l10-001_understanding_color_en.pdf) 4. Measure L (lightness), a, b* (color axes) at grid points:- Front, back, two sides
- High/low on body
- Shoulder if colored or frosted
ΔE between points and relative to the standard tells if the coating is visually consistent across the bottle and from batch to batch.
-
Contact-angle and surface-energy checks
Put small water (or test liquid) droplets at several positions and follow the ASTM D7334 advancing contact angle measurement 5:- Low angle, good wetting → good coverage, high energy.
- High angle, poor wetting → thin spots, contamination, or missing coating.
This works well for slip layers, hydrophobic / oleophobic coatings, and primers.
-
Adhesion tests (cross-hatch + tape)
Make cross-cuts in the coating grid with a standardized cutter, apply tape, and peel using the ASTM D3359 cross-hatch tape test 6. Do this:- Body
- Shoulder
- Any high-stress area (for example near embossing)
The removal pattern shows if cure and coverage are uniform.
Each test sees a different “dimension” of uniformity. Together they give a full picture: visual, optical, mechanical, and functional.
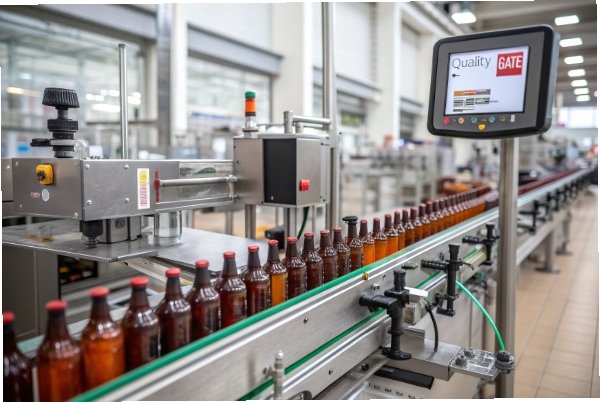
Can inline vision, IR, or thickness gauges check coverage at line speed?
Offline checks keep the lab busy, but they cannot protect every pallet. For high volumes, inline systems must take over most of the uniformity checking.
For bottles, optical and thermal data are easiest to capture at speed. Real-time color cameras, IR cameras, and sometimes inline thickness sensors can all help.
Inline tools that really work on bottles
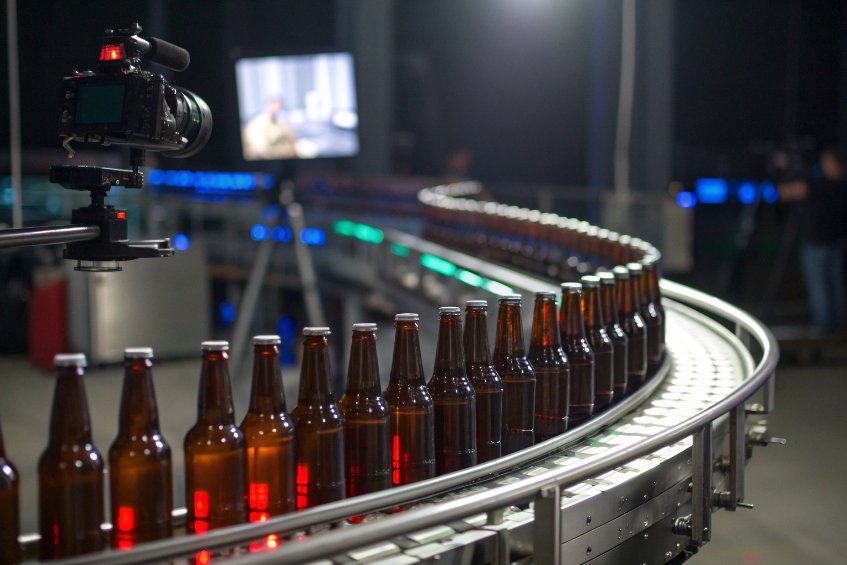
- Color and intensity vision systems
High-speed cameras with controlled LED lighting can detect:
- Streaks and bands in tinted coatings
- Gloss differences that show as variations in reflected intensity
- Skips or holidays, especially when combined with backlight or side-light
For etch-look and colored coatings, this is often the first inline barrier.
- UV fluorescence imaging
If the coating can tolerate a low-level fluorescent tracer, UV light plus cameras are powerful:
- Dark areas → low or no coating
- Bright areas → heavy build
This is very sensitive to thin spots, especially for clear protective coats where color cameras see almost nothing.
- Infrared (IR) cameras
IR is not only for temperature. It can also show:
- Coating wetness and drying gradients
- Variations in emissivity caused by different coating thicknesses
Right after an oven or UV zone, IR imaging helps confirm that cure and film build are consistent around each bottle.
- Inline thickness / weight proxies
True inline thickness gauges for bottles are still rare, but there are indirect ways:
- If the coating is conductive or contains a specific element (for example Sn, Ti, Al), inline XRF or eddy-current at fixed stations can measure average thickness or areal density on passing bottles or coupons.
- For some systems, inline scales with witness plates can trend total coating pick-up per minute.
These methods do not usually measure every square millimeter, but they give a continuous process signal, not just occasional lab values.
Making inline and offline work together
Inline systems are great at finding sudden issues, like:
- Blocked spray nozzles
- Empty coating tanks
- Fan pattern shifts
- Temperature or speed jumps
Offline lab tests are better for:
- Detailed mapping
- Adhesion
- Barrier performance
- Long-term durability
The best setup links them:
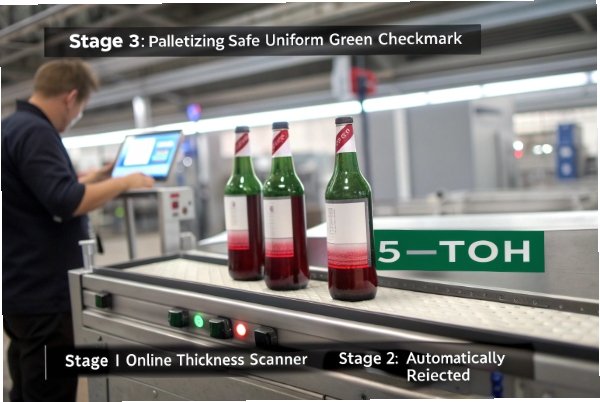
- Inline vision / IR triggers alarms and rejects when the process drifts.
- Lab confirms root cause and adjusts the reference limits when the process or coating changes.
This way uniformity control does not depend on one inspector’s “good eye”.
How should sampling plans and control charts be set for SPC?
Many plants measure a lot, but still have no real control. Numbers sit in notebooks and spreadsheets, but no one reacts early.
To move from “measurement” to “control”, sampling and SPC rules must be clear: what to sample, how often, which charts, and which reactions.
Building a practical sampling plan
A good sampling plan is a compromise between risk and cost. A simple structure:
- Define critical characteristics
For coating uniformity these are often:
- Film weight (g/m²)
- Thickness (nm or μm) for technical layers
- Gloss and haze
- ΔE color vs standard
- COF (for slip layers)
- Adhesion grade (cross-hatch) on key zones
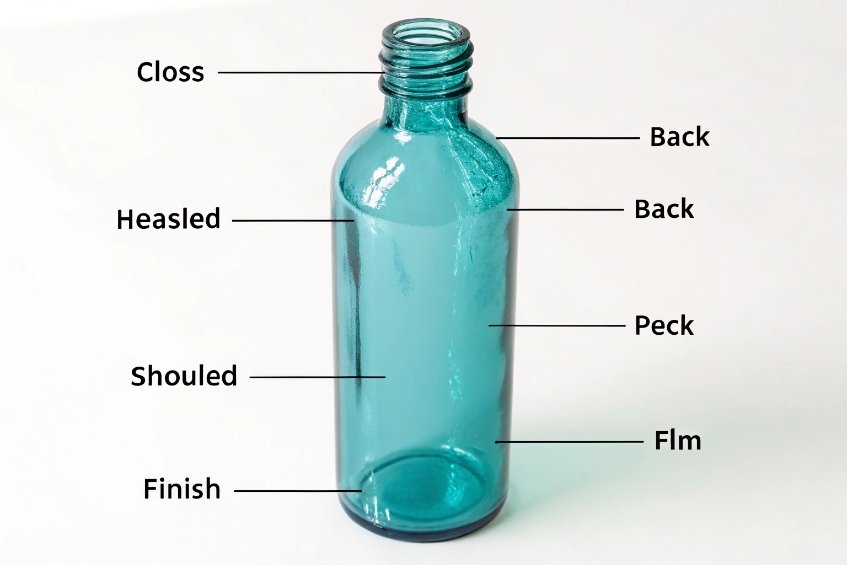
- Define sampling points on the bottle
Example:
- Position A: body front panel
- Position B: body back
- Position C: shoulder
- Position D: neck / finish if coated
Not every test needs all points, but they should be fixed and documented so trends are real, not random.
- Choose sampling frequency
Basic pattern:
- Start-up and changeover: higher frequency (for example, every 15 minutes or every 500–1000 bottles).
- Stable run: lower but still regular (for example, every hour or per batch / pallet).
- After any alarm or adjustment: temporary high frequency until control is proven again.
- Link samples to traceability
Each sample should tie back to:
- Date and time
- Line and section
- Coating lot, color, and batch
- Process settings (oven temperature, UV dose, line speed, spray pressure)
So when a drift appears on a chart, it is easy to find which pallets and which parameters are involved.
Picking the right control charts
Use the NIST/SEMATECH e-Handbook control charts guidance 7 as a common reference for chart selection and rules.
For continuous variables like film weight, thickness, gloss, and COF:
- X̄–R charts for group samples (for example, 5 bottles per check).
- Individual / moving range charts (I–MR) if only one value per interval is practical.
For attribute checks (pass/fail adhesion, visual defects):
- p-charts for proportion defective per sample.
- np-charts for number of defectives in a constant sample size.
Set control limits based on:
- A stable reference period (no big process changes).
- At least 20–25 subgroups if possible.
Then agree clear reaction rules:
- One point outside control limits → investigate and hold affected pallets.
- Trends or runs inside limits (for example, 7 points in a row up or down) → planned adjustment before non-conformance appears.
This prevents slow drifts from turning into large scrap piles.
What acceptance criteria apply for color, haze, and film thickness?
Acceptance criteria must be clear enough that quality, production, and customers all see the same bottle as “good”.
For coated bottles, appearance and function are both in play. So limits must cover color, haze, gloss, thickness, and sometimes slip.
Turning “nice look” into numbers
Typical criteria structures:
- *Color (Lab)**
- Define a standard (master) sample and its L, a, b* values.
- Set a maximum ΔE allowed between any bottle and this standard.
- Often, there is also a tighter ΔE in a single batch, and a slightly wider limit between batches.
This makes “too blue” or “too green” a number, not an argument on the packing line.
- Gloss and haze
- Choose the gloss angle (usually 60°, sometimes 20° for high-gloss or 85° for very matte).
- Define a target value and tolerance band for each key area (body, shoulder, neck).
- Haze limits help keep a consistent frosted or cloudy look.
Gloss and haze together describe the surface finish much better than gloss alone.
- Film weight / thickness
For each coating layer, define:
- Target film weight (g/m²) or thickness (nm / μm).
- Minimum and maximum limits that still give function and adhesion.
For multilayer systems, think in terms of stack:
- Some layers may have relative limits (for example, barrier layer must be ≥ X nm, topcoat between Y and Z μm).
- Witness coupons and XRF/ellipsometry data can form the base for these limits.
- Functional criteria
Appearance is not enough. Often we need:
- COF range for slip layers (for example: 0.08–0.14 under defined test conditions).
- Adhesion grade (cross-hatch: 0 or 1 only).
- Minimum scratch or mar load for hard-coats.
- After-wash or after-pasteurization appearance criteria.
All these should appear in a simple agreement between supplier and brand owner. That way, “uniformity” has a shared meaning from design to pallet inspection.
When these acceptance criteria link directly to the SPC charts and sampling plan, coating uniformity stops being a guessing game. It becomes a measurable, controllable part of the bottle process, just like gob weight or wall thickness.
Conclusion
Coating uniformity cannot rely on “looks okay” checks. It needs a toolbox of visual, optical, and functional tests, plus a clear SPC plan and acceptance limits for color, haze, thickness, slip, and adhesion.
Footnotes
-
Explains gravimetric coating weight/thickness calculations using mass and area for practical shop-floor checks. ↩︎ ↩
-
Shows how EDXRF works for non-destructive thickness and composition checks when coatings include measurable elements. ↩︎ ↩
-
Defines the standard instrument method for specular gloss readings at 20°, 60°, and 85°. ↩︎ ↩
-
Reference guide for CIELAB values and ΔE so color uniformity decisions match customer perception. ↩︎ ↩
-
Practice for measuring advancing contact angle to evaluate wetting, coverage risk, and surface-energy consistency. ↩︎ ↩
-
Standard tape test procedure to rate adhesion and quickly reveal weak cure or poor surface preparation. ↩︎ ↩
-
Clear overview of control charts and how to interpret signals so sampling becomes actionable SPC. ↩︎ ↩