Many teams want to switch to glass for branding and sustainability positioning 1, but the finance side worries about cost, freight, and breakage dragging down margins.
Glass does not always “beat” plastic on ROI. It wins when higher price, brand premium, or refill loops outweigh higher unit, freight, and handling costs.

So the key question is not “glass or plastic?” but “in this channel, with this product and price point, which packaging mix gives the best total return over time?”
How do tooling, mold, and line-change costs differ between glass and plastic?
Packaging changes often stall because tooling budgets explode and factories hate long changeovers. This is where glass and plastic behave very differently.
Tooling and line-change costs are usually higher and slower to recover for glass, while plastic lines often give cheaper molds, faster changeovers, and lower upfront capex for simple shapes.
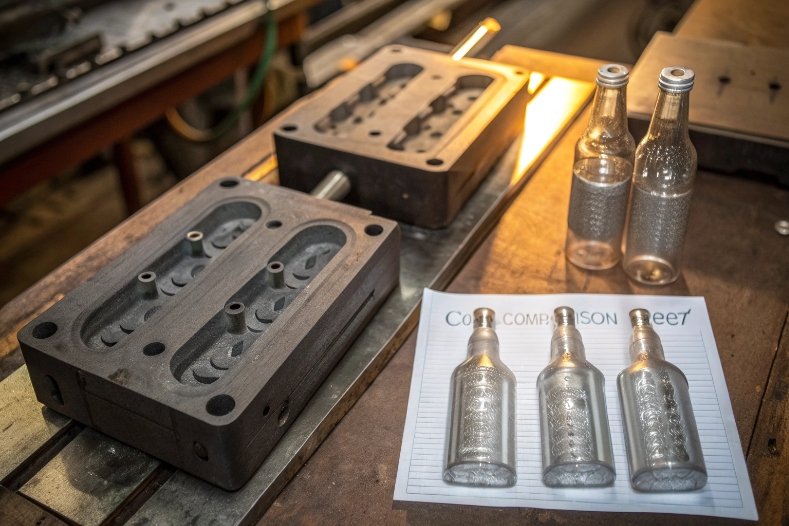
Glass tooling is more specialized. Molds must handle high temperatures and heavy mechanical wear. They have tighter links to furnace setup, forming machines, and gob weight. This makes each new design more serious as a capex decision. Resources on glass bottle mold cost and lifespan 2 show how strongly design stability affects amortization.
Plastic tooling costs can also be high, but there is more flexibility: you can blow-mold, injection-blow, or injection-mold with different cycle times and lower temperatures. For very high volumes, both systems need investment, but plastic usually wins if the shape is simple and light, and guides on plastic bottle tooling economics 3 reflect this advantage.
Plastic also tends to allow more rapid changeovers. PET preform-based systems can switch bottle designs by changing preforms and blow molds. Many factories already run several SKUs on one line. Glass lines can do multiple SKUs as well, but each mold set change and gob adjustment is slower and riskier for quality if not planned well. That means every new glass SKU must “earn back” more downtime and setup.
Glass has one hidden advantage: very long mold life for stable designs. A good set of molds can run for years with maintenance, especially on standard bottles and jars. Once you lock in a design, the tooling cost per unit becomes very low at scale. Plastic molds may need replacement or refurbishment more often if cycle speeds are aggressive or material is abrasive.
Tooling and changeover comparison
| Aspect | Glass Bottles | Plastic Bottles |
|---|---|---|
| Mold cost per design | Medium to high | Medium (varies by process) |
| Mold life at scale | Long for stable shapes | Good, but can wear faster at high speed |
| Changeover time | Slower, more setup risk | Often faster and more flexible |
| Line capex for hot-fill / carbonated | Higher for glass in many cases | Lower for cold-fill PET lines |
| Best fit | Premium, stable SKUs | Many SKUs, fast innovation cycles |
From an ROI view, plastic often wins in fast-moving, innovation-heavy categories where designs change every year. Glass pays off when you plan to run the same shape long enough to amortize tooling and use it as a brand asset.
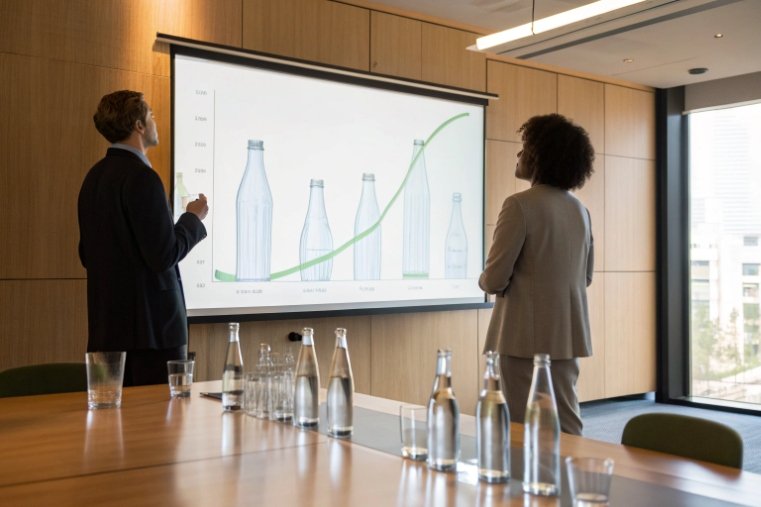
Can higher brand value and refill programs offset glass logistics costs?
The biggest fear with glass is simple: “It is heavy, it breaks, freight will kill our margin.” The biggest opportunity is also simple: “We can charge more and keep customers longer.”
Higher perceived value, better shelf presence, and well-designed refill and return bottle systems 4 can offset glass’s higher logistics cost, but only if your positioning and channels support a real price premium or strong reuse rates.
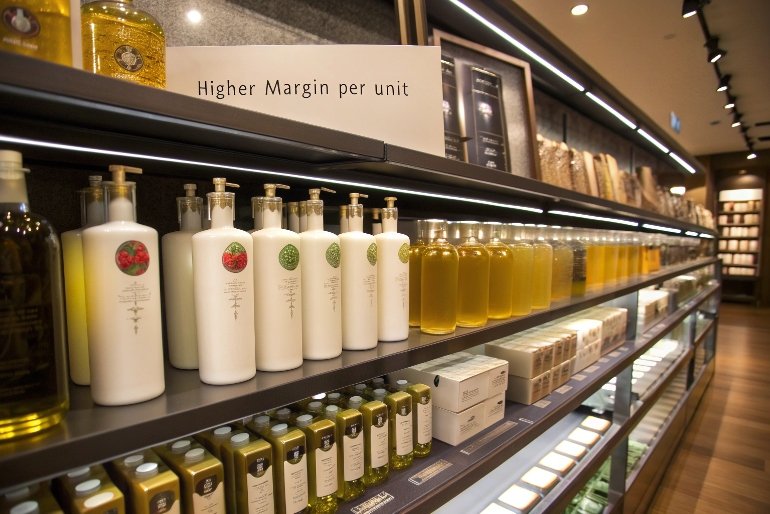
Glass supports premium pricing because it looks and feels more valuable. The weight in hand, the clarity, and the sound of the cap give consumers “quality cues” that plastic struggles to match. For beverages, condiments, oils, and cosmetics, this can move a product from “commodity shelf” to “specialty shelf.” That shift can lift gross margin per unit more than the extra packaging and freight cost.
However, this only works if the market is willing to pay. In discount channels or very price-sensitive regions, glass may not recover its cost. In on-premise and horeca channels (restaurants, bars, hotels), glass performs better because:
- Freight distances are shorter.
- Breakage risk is lower due to controlled handling.
- Customers expect glass for premium experience.
Refill and return programs change the income statement again. A sturdy glass bottle can survive many cycles if you design it right and protect it in crates. Each extra trip lowers the effective packaging cost per use. If you integrate deposit or incentive systems, you can also build loyalty and lock in repeat buyers.
Brand and reuse economics
| Lever | How It Helps Glass ROI |
|---|---|
| Shelf price premium | Covers higher unit and freight cost |
| Brand perception | Increases lifetime value and repeat purchase |
| Refill programs (in-store) | Lower packaging cost per refill, more visits |
| Returnable loops | Amortize bottle cost over many trips |
| Local / short-haul focus | Reduces freight penalty and breakage risk |
A simple way to think about it:
If the realistic price premium + reuse savings per unit is larger than the incremental cost of glass vs plastic, glass can deliver better ROI. Without that premium or reuse, plastic usually wins on profit per pallet.
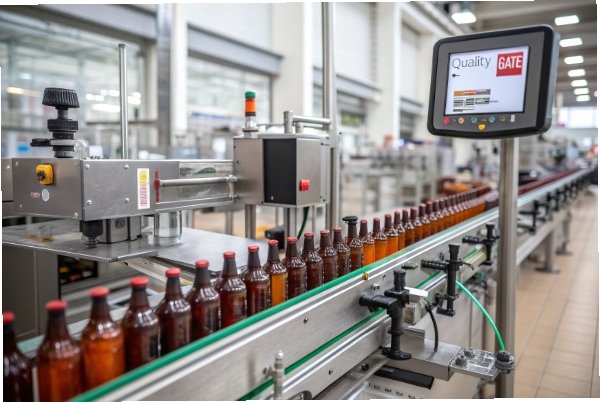
What do defect rates, breakage, and returnable cycles mean for TCO?
Finance teams often look at unit price and freight and stop there. In practice, total cost of ownership (TCO) depends heavily on defects, breakage, and how many trips a returnable package can actually survive.
Higher glass breakage and handling losses can erase margins if quality and logistics are weak. On the other hand, low defect rates and long returnable cycles can give glass a lower cost per use than one-way plastic.
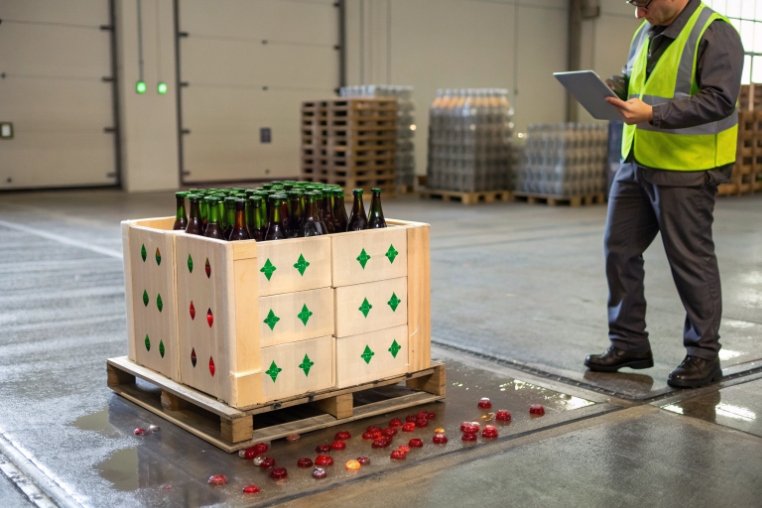
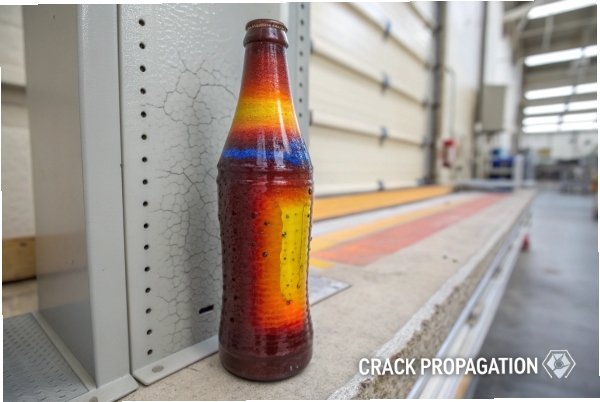
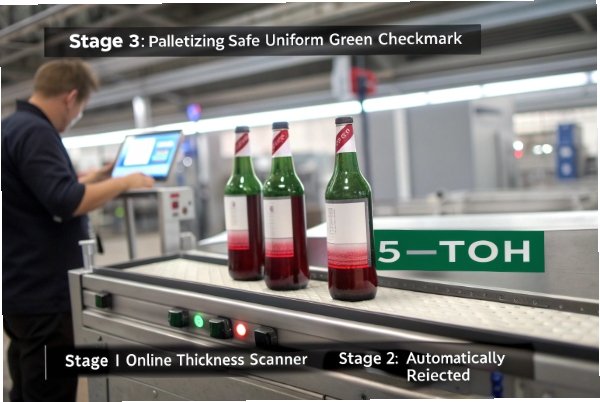
Glass has two main loss modes: factory defects and supply chain breakage. Defects include stones, blisters, thin walls, or internal stress that cause cracks during filling or pasteurization. Strong QA, annealing, and on-line inspection keep these under control. Breakage in logistics comes from poor palletizing, impacts, and improper handling. Good packaging design, dividers, and training help here, and case studies on returnable glass bottle durability 5 highlight how washing and handling affect service life.
Plastic has fewer catastrophic “shatter” losses, but it has its own hidden TCO issues:
- Paneling or deformation under hot-fill or vacuum.
- Stress cracking from aggressive ingredients or cleaners.
- Oxygen ingress that reduces shelf life and leads to write-offs.
Returnable cycles change the equation again. A heavy, durable glass bottle can do tens of trips if:
- You have strong crates or racks.
- Washers de-label and clean gently but thoroughly.
- Handling rules avoid impacts in reverse logistics.
Each additional trip spreads the original bottle cost over more sales units. If breakage and loss remain low, the “cost per use” can drop below one-way plastic, especially in local or regional loops.
Simple TCO view
| Cost Driver | Glass (One-Way) | Glass (Returnable) | Plastic (One-Way) |
|---|---|---|---|
| Packaging cost per unit | High | High at first, lower per trip | Low to medium |
| Breakage / loss | Medium–high if unmanaged | Medium; improves with practice | Low (impact), higher for shelf-life loss |
| Shelf-life related write-offs | Low | Low | Medium–high for sensitive products |
| Washing / handling capex | Low | High (washers, crates) | Low |
| Cost per liter over time | Stable, depends on freight | Can become very low at scale | Low but tied to single use |
So TCO is not a one-line answer. For short-life, uncarbonated, cheap products, one-way plastic usually wins. For stable, returnable, local systems with high crate discipline, glass can become a cost champion over several years.
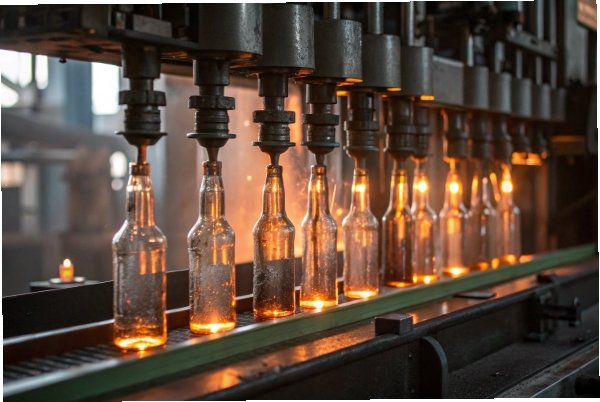
How do energy use and cullet content influence long-term margins?
Glass is often criticized as “energy hungry.” That is true in absolute furnace temperature, but the long-term picture is more complex once you factor in cullet content, furnace efficiency, and policy trends.
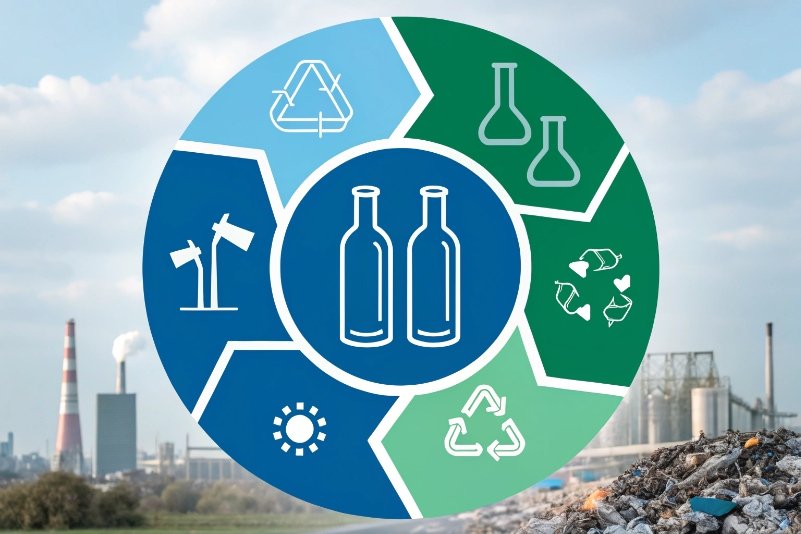
Higher cullet (recycled glass) content in furnaces 6 and modern furnace technology reduce energy use, cut emissions, and can lower material cost. Over time, this can protect margins in markets with carbon pricing or strong recycling incentives.
Melting virgin glass batch requires high energy. As energy prices rise, this hits operating costs hard. However, every percentage of cullet in the batch reduces:
- Melting temperature.
- Fuel or electricity per ton.
- CO₂ emissions from raw materials and fuel.
In some regions, policy already rewards higher recycled content, either through lower fees, tax benefits, or better EPR scoring. This can turn cullet access into a real competitive edge. Plants close to good collection systems have a structural advantage in both cost and marketing.
Plastic uses less energy per kilogram to process, but:
- Resin price is tied to oil and gas markets, which are volatile.
- Regulations on single-use plastics and recycled-content targets are tightening.
- High-quality food-grade recycled PET or HDPE can become expensive or scarce.
Glass’s material cost becomes more stable when you have:
- Reliable cullet streams.
- Partnerships with bottle banks, deposit schemes, or large customers.
- Good sorting that keeps colors and contamination under control.
Energy, cullet, and margin link
| Factor | Effect on Glass ROI |
|---|---|
| High cullet content | Lower energy per ton, lower CO₂ fees |
| Energy-efficient furnaces | Improved operating margin long term |
| Local recycling systems | Better cullet quality, less transport cost |
| Carbon taxes / EPR fees | Penalize energy and weight, but also reward circularity |
For a supplier that invests early in high-cullet, efficient furnaces, the ROI of glass improves over time. You cut variable costs and gain a stronger sustainability story that buyers can use on pack and in reporting.
At the same time, differential EPR or packaging taxes can shift the balance between materials. Some schemes charge higher fees per tonne for certain plastics than for glass, and analyses of EPR packaging cost impacts 7 show how quickly policy can change margins.
Conclusion
Glass beats plastic on ROI when you monetize premium branding or reuse loops and control quality, cullet, and logistics; plastic wins when speed, low unit cost, and light weight matter most.
-
Article explaining total cost and sustainability trade-offs between glass and plastic packaging. ↩
-
Cost–benefit overview of glass versus plastic soda bottles, including mold cost and lifecycle. ↩
-
Guide to how plastic injection-mold tooling cost and complexity scale with part design. ↩
-
Explanation of how beverage refill and deposit–return systems work and where they perform best. ↩
-
Technical blog on extending returnable glass bottle life through optimized washing processes. ↩
-
Industry factsheet quantifying energy savings from higher cullet content in glass furnaces. ↩
-
News analysis of UK EPR packaging fees and how material-specific taxes affect margins. ↩