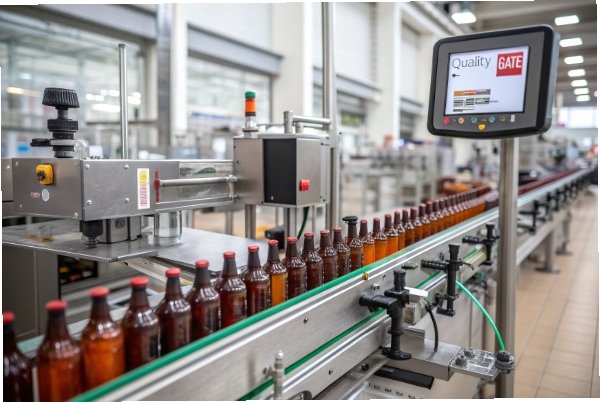
Scratches can ruin a premium bottle in one hour. The line still runs, but the shelf look fails, and returns start to arrive.
Yes. Composition changes hardness, chemical durability, and how many micro-defects exist at the surface, so it can move scratch-test results even before coatings and handling are considered.

Why scratch tests reflect both surface chemistry and process history
Scratch resistance is not one property. It is the outcome of how the surface reacts to contact, how easily micro-cracks start, and how fast those cracks grow under load. Composition matters because it controls the glass network strength, the alkali level at the surface, and the tendency to form weak layers during forming and cooling. Still, scratch tests also “read” the process. A strong glass can still scratch badly if the surface is rough, if cords reach the surface, or if stones and crystals create hard points.
Three ideas help make scratch results predictable.
Hardness is not the whole story
Vickers hardness 1 often improves when the network is tighter. Higher SiO₂ and modest Al₂O₃ usually help. Lower Na₂O usually helps too. But a scratch test is not only hardness. It includes friction, local heating, and flaw growth. A slightly softer glass with a smoother and cleaner surface can outperform a harder glass that carries surface defects.
Surface flaw density decides the first scratch
Most “first visible scratches” begin at micro-flaws. Those flaws come from seeds, devit skins, unmelted grains, refractory specks, and surface hydration. Composition changes how easily these flaws form, and it changes how the surface ages in humid storage before testing.
Tests punish non-uniformity
Two bottles with the same recipe can score differently if one has cords near the surface or a devit line from a cold forehearth corner. Scratch tests are sensitive to local weak zones.
| What changes | Composition lever | Process lever | What the scratch test shows |
|---|---|---|---|
| Network strength | SiO₂, Al₂O₃ | Forming temperature stability | Higher load before damage |
| Surface chemistry | Na₂O, MgO/CaO | Hot-end humidity and cooling | More or less haze and scuffing |
| Defect population | TiO₂, excess CaO, Zr carryover | Fining, cullet QC, devit control | Random deep scratches and streaks |
| Friction behavior | Minor additives and surface condition | Hot-end/cold-end coatings | Scuffing vs clean glide |
A few years ago, a customer returned a pallet because “the glass scratches too easily.” The recipe was not the real issue. The cullet stream had more ceramics for two weeks, and the forehearth had a cold corner. After those were fixed, the same composition passed the scratch spec again.
If scratch is treated as a system result, composition tuning becomes a reliable tool instead of a gamble.
Now the direct questions.
Which oxide balance (SiO₂–Na₂O–CaO–MgO) and Al₂O₃/B₂O₃ additions most increase Vickers hardness and reduce scratches?
Scratches feel like a coating problem. Many teams forget that the base glass sets the starting point for hardness and crack resistance.
A tighter network usually scratches less: slightly higher SiO₂, controlled Na₂O, balanced CaO/MgO, and modest Al₂O₃ (about 1–2 wt%) often increase Vickers hardness; small B₂O₃ (about 0.5–2 wt%) can help surface durability but must be dosed carefully.
How the big four move hardness and scratch behavior
In soda-lime container glass, the big four set the baseline.
-
SiO₂: raises hardness and chemical durability. It also raises viscosity 2, so melting and forming need more energy or better control.
-
Na₂O: lowers viscosity and helps melting. Too much Na₂O can soften the network and can raise surface alkali, which can increase hydration and micro-weakening.
-
CaO: stabilizes the glass and supports durability. Too much CaO can raise liquidus and devit risk, which then hurts scratch results through crystals and rough skins.
-
MgO: helps durability and can help devit control when balanced against CaO. It can also change the working range and surface behavior.
A practical “safe” container window is often close to:
-
SiO₂: ~71–74 wt%
-
Na₂O: ~12.5–14.5 wt%
-
CaO: ~8.5–10.5 wt%
-
MgO: ~2–4 wt%
These are not magic numbers. They are a stable start.
Why Al₂O₃ helps scratch resistance at modest levels
Alumina 3 is a strong intermediate oxide. Around 1–2 wt% often improves:
-
network rigidity and hardness
-
resistance to surface hydration
-
stability of viscosity under small drift
This usually reduces fine scuffing and helps the surface survive handling. Still, if Al₂O₃ is pushed too far without other changes, melting can slow and stones can rise. That can harm scratch results because defects increase.
Where B₂O₃ fits, and where it hurts
Boron oxide 4 can improve melt behavior and can improve some surface durability behavior in certain systems. In small levels, 0.5–2 wt% can help reduce devit tendency in some compositions and can improve homogeneity, which helps scratch performance.
But B₂O₃ must be controlled because it can:
-
change volatility and batch loss
-
shift the working range
-
change how coatings wet the surface at the hot end
| Composition move | Expected scratch effect | Main risk | What to watch in trials |
|---|---|---|---|
| +SiO₂, -Na₂O (small shift) | Higher hardness, less scuff | Higher viscosity | Gob temp stability, melt rate |
| +Al₂O₃ to ~1–2% | Better hardness and surface durability | Slower melting if too high | Seeds, cords, energy use |
| Add B₂O₃ 0.5–2% | Better homogeneity, sometimes less devit | Volatility, working range shift | Color drift, fining stability |
| Raise CaO too high | Often worse due to devit skins | Higher liquidus | Devit lines, feeder deposits |
| Adjust MgO/CaO ratio | Can reduce surface devit | New phase risk if extreme | Liquidus phase, forehearth cold spots |
The best plan is to tune in small steps, then confirm with both hardness checks and real scratch tests on bottles from stable production days.
Do Fe₂O₃, TiO₂, and trace contaminants increase surface flaw density and worsen scratch test ratings?
A bottle can fail scratch tests even when hardness is high. That often happens when the surface carries many tiny defect starters.
Yes. Fe₂O₃ usually affects scratch results indirectly through redox, cords, and inclusions; TiO₂ and some trace contaminants can increase nucleation, devit skins, and hard particles, which raise flaw density and lower scratch ratings.
Iron: not a scratch villain by itself, but it can create the conditions
At normal container levels, iron does not automatically increase scratch. The indirect paths are more important:
-
iron ties into redox, which affects fining behavior and cord formation
-
corded regions can have different local structure and can create weak surfaces
-
iron-rich contamination from cullet can travel with other contaminants like Cr, Ni, and ceramics
If scratch failure appears with a color drift event, the root cause is often “cullet stream change,” not iron alone.
TiO₂: a known nucleation helper that can raise devit and haze risk
TiO₂ is often controlled as an impurity in container glass. At higher levels, it can raise the chance of crystallization or haze in certain temperature bands. Those crystals or skins increase surface roughness. Rough surfaces scratch sooner because the contact load concentrates at peaks.
Trace contaminants that raise flaw density
Scratch results often get worse when the surface has more:
-
stones (undissolved silica, zircon carryover, refractory specks)
-
devit flakes from forehearth walls
-
cords and striae reaching the surface
-
seeds that pop at the surface during forming
These are not “soft” defects. They create hard points and stress concentrators.
| Contaminant / oxide | How it worsens scratch outcomes | Typical source | Best prevention habit |
|---|---|---|---|
| Titanium dioxide 5 (high or unstable) | Devit skins, haze, rougher surface | Sand or mixed cullet | Low-Ti sand spec, cullet sorting |
| Zr-rich particles | Stones, hard points | Refractory wear or zircon sand | Refractory control, filtration discipline |
| Cr/Ni traces | Color drift + possible defect linkage | Mixed cullet, metal pickup | Cullet governance, magnets, cleaning |
| Excess Fe with organics | Redox swing, cords, surface non-uniformity | Dirty cullet | Clean cullet, stable combustion |
| Ceramics (CSP) | Hard inclusions, scratch starters | Cullet stream | Incoming cullet QC, supplier control |
A scratch problem that looks “random” is often a defect population problem. Composition can reduce sensitivity, but contamination control usually gives the fastest gain.
How do cullet quality, fining chemistry, and furnace redox control influence surface homogeneity and abrasion outcomes?
When scratch scores drift week to week, the recipe is often unchanged. The drift usually sits in cullet and furnace stability.
Cullet quality changes trace metals and hard inclusions, fining chemistry changes bubble and salt behavior, and furnace redox changes Fe²⁺ share and melt structure; together they change surface homogeneity and can swing abrasion outcomes at the same composition.
Cullet quality: the biggest variable in real plants
High cullet can improve melting and reduce unmelted batch grains, which helps surface quality. Still, cullet 6 also brings:
-
ceramics and stones that become scratch starters
-
mixed colors that change redox response
-
organics that create local reducing zones near the doghouse
For scratch stability, the key is not only “cullet %.” The key is cullet variance.
Fining chemistry: seeds and salts can turn into surface flaws
If fining is unstable, more seeds survive. Some seeds become tiny surface pits or pop marks during forming. Those spots scratch faster. Sulfate-based fining can also create salt carryover behavior if feeds swing. That can change surface condition and can create small roughness events.
Furnace redox: makes the melt more or less uniform
A stable oxygen potential helps the melt homogenize. Redox 7 swings can:
-
change iron valence and local structure
-
change how sulfate decomposes and how foam behaves
-
increase cords if the melt has redox bands
Cords near the surface behave like weak paths under abrasion.
| Process control | What to measure daily | What improves scratch results | What usually breaks it |
|---|---|---|---|
| Cullet cleanliness | CSP counts, color contamination, moisture/organics | Lower defect starters | Supplier drift, poor sorting |
| Fining stability | seed rate, foam behavior, SO₃ trend | Smoother surface, fewer pits | Feed pulses, pull changes |
| Redox stability | Fe²⁺/Fe_total trend, combustion O₂ stability | Fewer cords, stable surface chemistry | Air/fuel swings, organics spikes |
| Forehearth profile | cold spots and dead zones | Less devit skin | Temperature waves, poor circulation |
A plant can spend money on better coatings and still lose scratch ratings if cullet and redox are unstable. Fixing homogeneity first makes coatings work better.
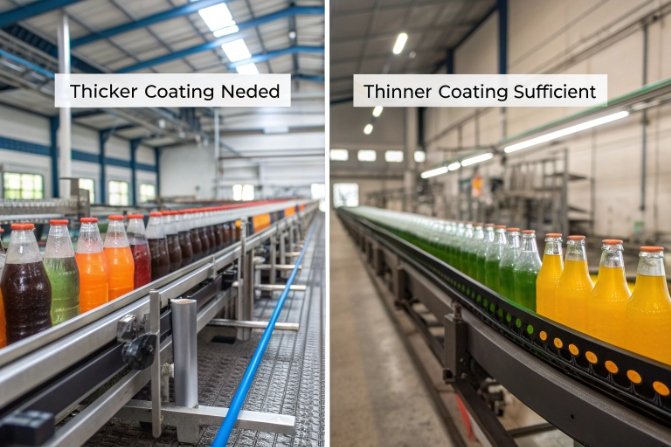
Can tuning composition lower dependence on hot-end (SnO₂/TiO₂) and cold-end (PE/ceramic) coatings while meeting ASTM/ISO scratch limits?
Coatings often feel like the only solution. Still, coatings cost money, add complexity, and can fail if the base surface is rough.
Composition tuning can reduce scratch sensitivity and cut coating demand, but it rarely replaces coatings on high-speed lines; the best goal is to use composition to raise baseline hardness and surface quality, then use coatings as a lighter, more stable final layer to meet ASTM/ISO limits.
What composition can do well
Composition can:
-
increase hardness (often via modest Al₂O₃ and careful Na₂O control)
-
reduce devit tendency that creates rough skins (via MgO/CaO balance and impurity control)
-
reduce hydration sensitivity that creates a weaker surface layer in storage
-
reduce defect population that starts deep scratches
These changes make scratch tests more repeatable. They also reduce the need for heavy coating doses.
What composition cannot do by itself
In real distribution, glass rubs against glass. Even a hard glass can abrade under high contact pressure. Hot-end and cold-end coatings 8 are designed to reduce friction and protect against scuffing during handling. So the question is not “coating or composition.” It is “how to make both easier.”
A balanced strategy that reduces coating load
A practical path that usually works:
1) Stabilize the base glass window (avoid big Na₂O and CaO swings).
2) Add Al₂O₃ near 1–2 wt% if the melt can support it.
3) Keep TiO₂ and hard inclusions low by stronger cullet QC.
4) Use coatings, but tune them down after the base surface is clean and uniform.
5) Validate with the same scratch method 9 the customer uses, on real bottles from stable runs.
| Lever | How it reduces coating dependence | Main trade-off | Best validation method |
|---|---|---|---|
| +Al₂O₃ (modest) | Higher baseline hardness | Melting energy, seeds risk | Hardness + scratch test correlation |
| Better MgO/CaO ratio | Less devit skin, smoother surface | Liquidus phase must stay safe | Forehearth devit monitoring |
| Lower contaminants (Ti, Zr, CSP) | Fewer scratch starters | Higher cullet cost | Incoming QC + defect tracking |
| Stable fining and redox | Less cords and pits | Tight operations discipline | UV–Vis/seed trend + scratch trend |
| Lighter coating recipe | Lower cost and fewer coating defects | Narrower safety margin | Full handling simulation + scratch limits |
When the base glass is tuned well, coating becomes a controlled finishing step, not a rescue step. That is the point where ASTM/ISO scratch limits become easy to meet, even as production speed rises.
Conclusion
Yes. Composition changes hardness and flaw density, but the biggest scratch gains come when composition tuning is paired with clean cullet, stable fining/redox, and lighter, more stable coating use 10.
Footnotes
-
Vickers hardness measures the resistance of glass to localized plastic deformation, a key indicator of scratch potential. ↩
-
Viscosity determines the melt’s flow properties, influencing forming stability and surface defect rates. ↩
-
Alumina is a network intermediate that increases glass hardness and chemical durability at moderate concentrations. ↩
-
Boron oxide can lower the melting temperature and improve chemical resistance but may affect volatility. ↩
-
Titanium dioxide can promote nucleation and crystallization, potentially leading to surface roughness and scratches. ↩
-
Cullet quality directly impacts melt homogeneity and the presence of scratch-inducing inclusions like ceramics. ↩
-
Redox control ensures consistent melt chemistry, minimizing cords and non-homogeneities that weaken the glass surface. ↩
-
Surface coatings modify friction and protect the glass surface from abrasion during handling and transport. ↩
-
Standardized scratch testing methods provide quantitative data to validate improvements in glass composition and coatings. ↩
-
Integrating composition tuning with optimized coating application offers a holistic approach to maximizing scratch resistance. ↩