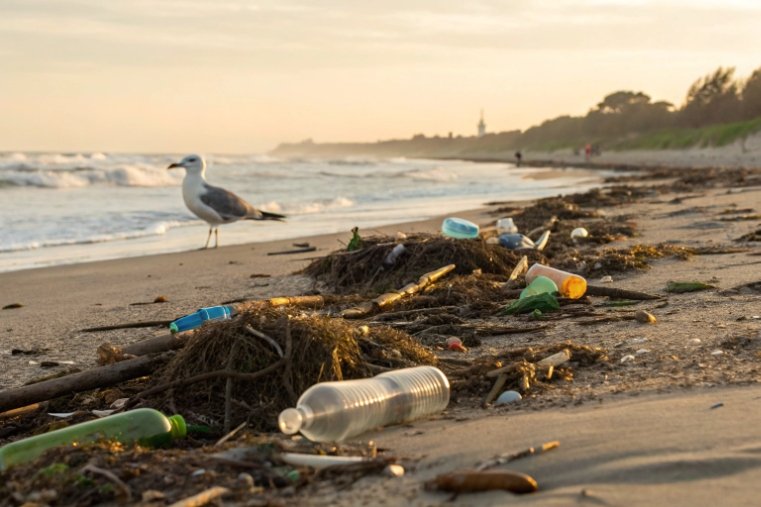
Plastic made products cheap to pack and ship, but the real bill shows up later on beaches, in rivers, and in EPR invoices.
Yes, brands are increasingly accountable—legally, financially, and reputationally—for plastic packaging impacts, and smart companies are using EPR, reuse, and material shifts (including glass) to protect both the planet and their P&L.

The question is no longer “Will responsibility come?” but “How do we design packaging and business models so that responsibility becomes a competitive advantage instead of a pure cost?”
How are EPR and recycling regulations shifting producer responsibility?
Many brands treated plastic as “out of sight, out of mind” once it left the warehouse. EPR laws 1 are changing that assumption very fast.
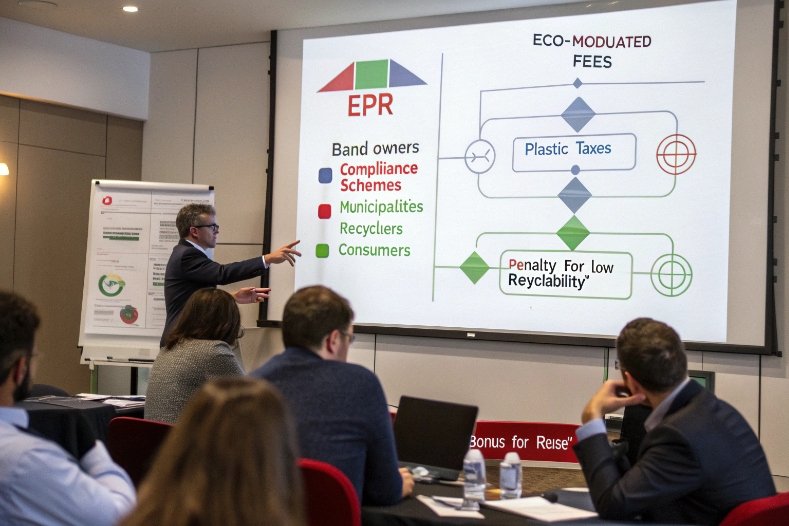
Extended Producer Responsibility (EPR) is moving end-of-life costs for packaging from taxpayers to producers, with eco-modulated fees that reward recyclable, reusable designs and penalize difficult or polluting formats.
What EPR actually does to a brand’s cost structure
Under EPR, producers pay fees to cover collection, sorting, and recycling or disposal of packaging. These fees are no longer flat. They vary with:
- Material type (mono-material vs complex laminates).
- Recyclability in real local systems.
- Recycled content share.
- Presence of problem additives (PVC, dark pigments, etc.).
In some regions, EPR now sits next to plastic taxes and minimum recycled-content rules. Step by step, this creates a steady extra “packaging line” on the brand’s cost sheet. It is not optional anymore.
From my side of the packaging conversation, this already shows up in RFQs. Buyers do not just ask “What is the unit price?” They ask “What does this design mean for our EPR fees and future regulation risk?”
Regional trends: convergence toward “polluter pays”
Europe, UK, North America (headline examples)
- EU: New packaging rules 2 push all packaging toward defined recyclability, introduce eco-modulated EPR fees, and set reuse and deposit targets for drinks.
- UK: Plastic Packaging Tax 3 adds a direct cost for packs with low recycled content, which pushes brands toward higher PCR or other materials.
- US states (like California): New laws combine recyclability targets, content mandates, and producer responsibility for plastic pollution.
These policies do not say “ban plastic.” They say “if you use plastic, you pay more when it is hard to recycle or contains too much virgin resin.”
What this means day to day
| Question from Regulators | Practical Impact on Brands |
|---|---|
| Is it recyclable in practice? | Complex multilayers get higher EPR fees |
| Does it contain recycled content? | Low-PCR packs face extra taxes / penalties |
| Is there a reuse / return system? | Strong systems can earn fee reductions |
| Are claims honest and proven? | Greenwashing can trigger fines and lawsuits |
For many categories, this is pushing a real shift: fewer complex plastics, more mono-material solutions, more recycled content—and more serious discussion of glass and metal in certain segments.
Would switching SKUs to glass reduce litter and microplastics exposure?
Teams often ask a simple question: “If we move from plastic to glass, do we automatically become a “clean” brand?” The answer is more nuanced than many expect.
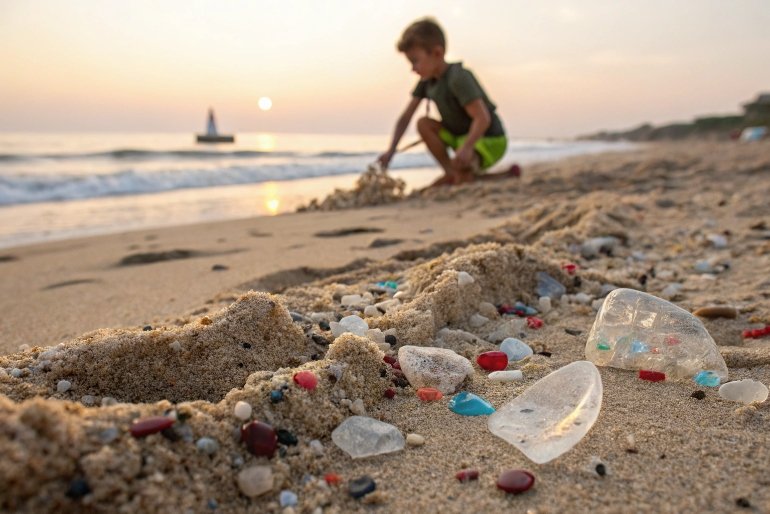
Switching from plastic to glass for suitable SKUs can cut microplastics and some types of litter risk 4, but it does not erase environmental impact; glass is heavier, more energy-intensive, and still appears as sharp litter if waste systems fail.
Microplastics and toxic load vs visible glass fragments
Plastic’s long tail
Plastic breaks down into smaller and smaller pieces under UV, waves, and abrasion. These fragments:
- Enter food webs and drinking water.
- Carry additives and adsorbed pollutants.
- Are extremely hard to clean up.
Every lightweight bottle or film that escapes into the environment becomes a long-term, invisible problem.
Glass behaves differently:
- It does not generate microplastics.
- It is chemically far more inert in soil and water.
- Fragments remain visible and localized, though sharp and dangerous in the short term.
Switching some SKUs from plastic to glass reduces microplastic exposure downstream, especially for high-litter products like on-the-go drinks. But the total picture still depends on collection and consumer behavior.
Where glass genuinely reduces harm—and where it does not
Good candidates for glass
- Premium beverages in on-premise and controlled channels (bars, hotels, restaurants).
- Refillable or returnable systems with short transport distances.
- Products where glass is already preferred for performance: beer, wine, sauces, oils, serums, fragrances.
In these settings, glass is less likely to be littered, and reuse or recycling rates can be high. Here the switch does cut plastic leakage and microplastic risk without huge downsides.
Risky or marginal switch cases
- Very low-price, single-use, high-volume SKUs in regions with poor glass collection.
- E-commerce heavy products where breakage and transport emissions explode.
- On-the-go formats where bottles are more likely to be discarded in public spaces.
In those cases, a switch to glass might reduce microplastics but increase freight emissions, breakage losses, and safety risks from shards.
Balancing litter, microplastics, and logistics
| Impact Dimension | Glass (one-way) | Plastic (one-way) |
|---|---|---|
| Microplastic risk | Very low | High with leakage and wear |
| Short-term injury risk | High if shattered | Low (no sharp shards) |
| Visibility of litter | High (easy to see and remove) | Lower (can fragment and hide) |
| Transport emissions | Higher due to weight | Lower per liter |
| Best use | Controlled channels, reuse loops | Long distance, low-value, on-the-go |
So yes, switching some SKUs to glass can be part of a microplastics strategy—but only as part of a package that includes better collection, design for reuse, and consumer education.
What do LCAs show about carbon, reuse, and end-of-life outcomes?
When the debate gets serious, someone always says, “Show me the numbers.” Life Cycle Assessments (LCAs) 5 are the main tools brands use to compare glass and plastic on climate and resource use.
Most LCAs show single-use plastic (like PET) beating single-use glass on climate per liter delivered, mainly due to weight and energy, but refillable glass in short loops can outperform one-way plastic after enough trips.
Why single-use glass often looks worse on carbon
1. Energy-intensive melting
Glass furnaces operate at very high temperatures. Without high cullet content and efficient melting, energy and emissions per ton are significant. Plastics, by contrast, melt at much lower temperatures.
2. Transport and weight
Even a “light-weighted” glass bottle is far heavier than a PET bottle of the same volume. In a one-way system, that means:
- More energy per pallet to move.
- Higher emissions on long routes.
- Sometimes more secondary packaging to avoid breakage.
So if you compare a single-use 0.5 L glass bottle and a single-use 0.5 L PET bottle in a long distribution chain, the PET bottle usually has a lower carbon footprint per liter.
When glass starts to win in LCAs
Refillable glass changes the equation by spreading furnace energy, forming, and decoration over many trips.
Key drivers:
- Trip count: How many times does one bottle circulate before it is lost or retired?
- Return rate: How many sold units actually come back?
- Loop distance: How far do bottles travel between filling, consumption, and washing?
If bottles complete enough trips at short distances, LCAs often show:
- Lower climate impact per liter than one-way PET.
- Lower resource use (because the same physical bottle serves many sales).
- Less waste generation.
Of course, this requires capital for washers, crates, deposit systems, and reverse logistics.
End-of-life: recycling vs landfill vs leakage
| Stage | Glass | Plastic |
|---|---|---|
| Recyclability | 100%, infinite in principle | Technically recyclable, practical limits |
| Downcycling | Low (can be bottle-to-bottle) | High (often becomes lower-grade products) |
| Current recycling rates | Vary by region, often moderate | Also variable, often low in practice |
| Leakage behavior | Inert shards, no microplastics | Persistent microplastics and fragments |
LCAs increasingly include plastic pollution and microplastic risks as impact categories. As that happens, the “advantage” of lightweight plastics can shrink, especially in regions with poor waste systems.
So, LCAs do not give a simple “glass good, plastic bad” answer. They say: optimize for reuse + short loops or lightweight + high actual recycling—and always check real regional data instead of generic assumptions.
Which take-back or deposit models work best for beverages and cosmetics?
Responsibility does not end at design. It also lives in the business model that gets packaging back. Brands now have several tested options, especially for beverages; cosmetics are catching up.
For beverages, classic Deposit Return Systems (DRS) 6 with standardized, multi-brand glass bottles and crates work best; for cosmetics, refills, in-store returns, and mail-back programs are emerging as the most practical paths.
Beverage: proven models at scale
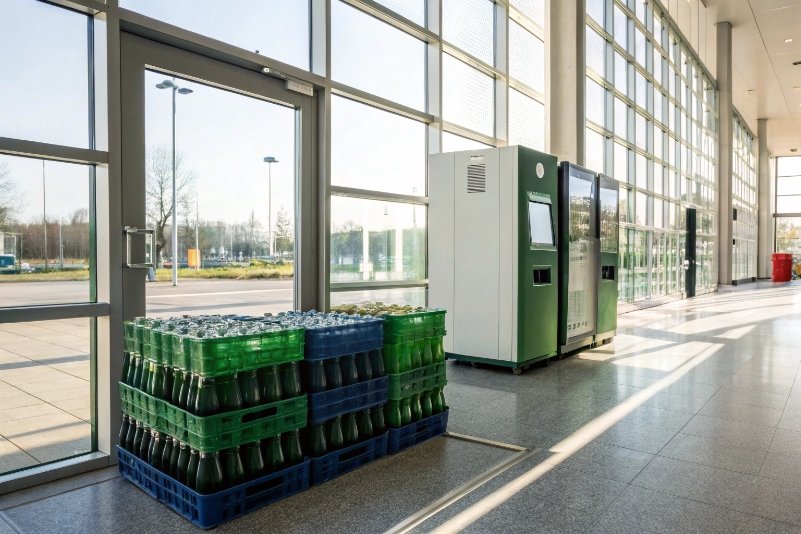
1. Deposit Return Systems for bottles
DRS schemes add a refundable deposit on each bottle. Consumers get that money back when they return empties to:
- Reverse vending machines.
- Store collection points.
- Dedicated return centers.
When the system uses standardized bottles across multiple brands, everything gets easier:
- Washing and sorting are simpler.
- Crates and pallets are shared.
- LCAs improve because each bottle can run through many loops.
Glass is very strong in these systems, especially for beer, soft drinks, and water in local or regional markets.
2. Reusable cups and takeaway models
For on-the-go drinks, some cities now run shared cup systems:
- Consumers pay a deposit for a standardized cup.
- They can return it to any partner outlet.
- Cups are washed centrally and recirculated.
This model can use glass, plastic, or metal. The key is the shared standard and convenient return points, not the material alone.
Cosmetics and personal care: more fragmented, but growing
Cosmetic packaging is more diverse in shape, closure, and decoration, so fully standardized reuse is harder. Still, we see workable patterns:
1. In-store refill and bottle reuse
- Customers buy a “forever” glass bottle or jar.
- They refill from bulk or semi-bulk dispensers.
- Brands use this as both a sustainability and loyalty tool.
2. Mail-back and take-back programs
- Customers mail empties back in prepaid envelopes or drop them at stores.
- Packaging is sorted for recycling or selective refill.
- Systems like this work best with robust, high-value glass packaging that can survive multiple cycles.
3. Hybrid models: refill pods plus glass outer shells
- A durable glass outer bottle carries the visual identity.
- Inner replaceable pods (which may be plastic) reduce total plastic volume.
- Over time, the outer shell’s impact is amortized over many refills.
What makes these models work financially?
| Success Factor | Why It Matters |
|---|---|
| Standardization | Lowers washing, sorting, and logistics cost |
| High return rate | Increases trips per container |
| Short logistics loops | Cuts transport cost and emissions |
| Durable, repairable packs | Avoids frequent replacement |
| Clear incentives | Deposits, discounts, or loyalty benefits |
For brands, the best models are the ones that combine real waste reduction with higher customer lifetime value and a clear, simple user experience. Glass fits these models well when the design is tough enough and loops are short.
Conclusion
EPR and new regulations are making brands pay for plastic’s true costs; shifting the right SKUs to glass, building refill and return programs 7, and designing for real recycling gives companies a way to stay profitable while taking genuine responsibility for their packaging.
Footnotes
-
Overview of extended producer responsibility policies shifting waste management costs from taxpayers to producers. ↩︎ ↩
-
Summary of EU packaging and packaging waste rules, targets, and producer obligations under PPWR reforms. ↩︎ ↩
-
Official UK guidance explaining Plastic Packaging Tax rules, thresholds, rates, and compliance responsibilities for businesses. ↩︎ ↩
-
UNEP explainer on plastic pollution, marine litter, and microplastics impacts on oceans and coasts worldwide. ↩︎ ↩
-
Case study comparing environmental life-cycle impacts of PET plastic bottles versus glass bottles in beverage packaging. ↩︎ ↩
-
Explanation of deposit return systems for beverage containers and how they boost recycling and litter reduction. ↩︎ ↩
-
Practical case studies showing how refill and reusable packaging systems can reduce waste and packaging costs. ↩︎ ↩